Operations | Monitoring | ITSM | DevOps | Cloud

Latest Videos

How to monitor SaaS Environments with a Google Chrome Plugin

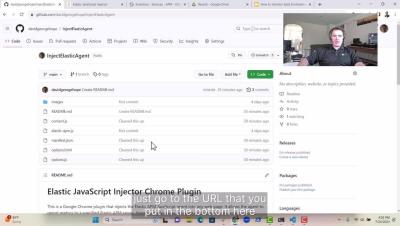
Explore the capabilities of this Chrome plugin, the 'Elastic APM JavaScript Injector'. This tool injects the Elastic APM JavaScript agent into any web page, allowing you to gather crucial performance metrics right in your browser. In this video, we walk you through the installation process, demonstrate how to set up your Elastic APM server URL, and show you how the plugin works in the background to measure performance metrics. Please remember, always respect privacy policies and only monitor sites you have explicit permission to monitor. Happy Monitoring!

How to Manually Instrument Java with OpenTelemetry (Part 1)

In this tutorial, we'll be diving into the world of OpenTelemetry and its application in Java. We'll take you step-by-step through the process of manually instrumenting a Spring Boot application.OpenTelemetry is an observability framework for cloud-native software and a powerful tool for capturing distributed traces and metrics from your application. This video will equip you with the knowledge and practical skills to utilize OpenTelemetry effectively and take your application monitoring to the next level.

How to Manually Instrument Java with OpenTelemetry (Part 2)

Part 2 video on OpenTelemetry (Otel) Instrumentation for Java is out now! Building upon the solid foundation we set in the first video, this installment takes a deep dive into the realm of backend calls, with a particular focus on Redis databases. We'll also explore the power and utility of the Tracing Filter - an essential tool for efficient monitoring and troubleshooting in distributed systems.

How to manually instrument iOS Applications with OpenTelemetry

In this tutorial, we dive into the practical application of OpenTelemetry in an iOS project built with SwiftUI. We demonstrate how to set up the OpenTelemetry SDK, generate spans, and send them to a configured OpenTelemetry collector. Our example application displays a random sentence every few seconds. Each sentence generation process is instrumented with OpenTelemetry spans, which include an attribute representing the word count of the sentence.

Custom Java Instrumentation with OpenTelemetry

Discover how to gain unparalleled visibility and traceability into your applications with our latest video! As an expansion of our blog post, this tutorial dives into the world of Site Reliability Engineering and IT Operations, guiding you step-by-step through the process of implementing a plugin for the OpenTelemetry Java Agent using its Extensions framework.

Elastic APM - Automatic .NET Instrumentation with OpenTelemetry

Check out this YouTube video on Elastic Application Performance Monitoring (APM) and its integration with OpenTelemetry for.NET! In this informative and practical tutorial, we delve into the world of APM and demonstrate how to effectively instrument your.NET applications using OpenTelemetry with Elastic APM. Additional Resources: Connect with us on social media.

How to Manually Instrument .NET Applications with OpenTelemetry

Welcome to our deep-dive tutorial on manually instrumenting.NET applications with OpenTelemetry! In this comprehensive guide, we walk you through the process of adding OpenTelemetry to your.NET applications to help you better understand and optimize their performance. Whether you're an experienced.NET developer or just getting started, you'll find actionable insights and tips to improve your application monitoring and tracing capabilities.