Operations | Monitoring | ITSM | DevOps | Cloud

Latest Videos

What is Observability? Grafana for Beginners Ep. 1

When you are getting started with observability, the jargon and concepts used to explain observability may go straight over your head. Let’s take out the complexity and talk about observability in the simplest terms possible. Join Lisa Jung, a senior developer advocate at Grafana, to get your learning on with the Grafana for Beginners series. You will learn about concepts such as observability and DevOps and how Grafana can be used to observe your system as a part of your DevOps practice.

Real user monitoring with Grafana (Grafana Office Hours #17)

Have you heard of Grafana Faro and how it can help in providing insights into your real user experience? Developer Advocates Nicole van der Hoeven and Marie Cruz chat with Software Engineers Kostas Pelelis and Marco Schaefer to discuss what Grafana Faro is, why it's important to have a real user monitoring solution, and how to get started with Grafana Faro.

Grafana panel title generator, interactive visualizations, and more

Dive deep into the enhancements in Grafana 10.2. From embedding interactive buttons within Canvas visualizations to utilizing AI for dashboard titles and descriptions, this release brims with features designed to optimize your Grafana experience. In this video, discover how to: Stay with us through this playlist to delve deeper into each addition and maximize your Grafana 10.2 experience.

How to navigate alerting insights in Grafana Cloud

Navigate your alerting systems in Grafana Cloud with the new Alerting Insights feature. This enhanced landing page provides a comprehensive view of your alerting data, from Grafana managed rules to Mimir managed rules, and highlights critical trends in your organization's alert management performance.

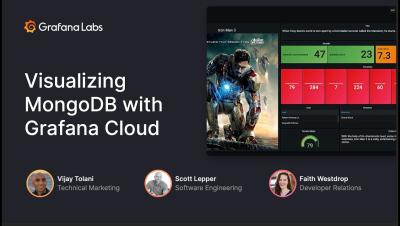
Visualizing MongoDB with Grafana Cloud

Learn to connect your MongoDB data and other data sources to a single dashboard to provide impactful insights into your business and improve visibility across teams. Vijay Tolani will demonstrate how to translate and transform your existing application and business metrics into flexible and versatile charts within dashboards using a wide array of visualizations, such as panels, bar gauges, geomaps, and more. Also query and alert on MongoDB and MongoDB Atlas data in real time without having to migrate or ingest it.

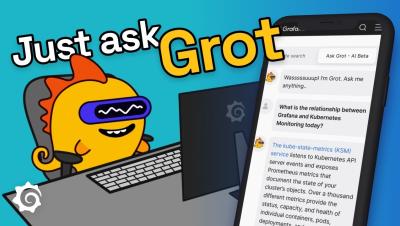
Grafana Labs' new AI-powered chatbot

Got questions about Grafana? Just ask Grot, Grafana's new AI-powered chatbot (still in beta). Built in partnership with Pal, a company that creates AI assistants for businesses, and inspired by our bulbous dino mascot, Grot the chatbot has been trained with large language models (LLM) on Grafana Labs’ own content. It can help you easily answer just about any question about our Grafana LGTM Stack, our open and composable hosted Grafana Cloud platform, and more — regardless of how narrow or broad the query might be or what language is set in your browser.

Agentless monitoring for Prometheus in Grafana Cloud (Grafana Office Hours #15)

Did you know you could do agentless monitoring for Prometheus in Grafana Cloud? Senior Software Engineer Matt Nolf talks about the new Metrics Endpoint integration and how you can use it to collect Prometheus metrics from publicly addressable hosts-- WITHOUT using Grafana Agent. He is joined by Developer Advocates Nicole van der Hoeven and Paul Balogh.

Distributed tracing with Grafana Cloud k6 (Grafana Office Hours #14)

Senior Software Engineer Łukasz Gut talks about a new feature: Distributed Tracing with Grafana Cloud k6. He discusses what distributed tracing is, why it matters, and how it can help teams find reliability issues faster. He is joined by Developer Advocates Marie Cruz and Nicole van der Hoeven.