Operations | Monitoring | ITSM | DevOps | Cloud

Latest Videos

Learning the tricks of Grafana Loki for distributed logging at scale in a Kubernetes environment

Logging can provide immense detail when used well, or it can become a firehose and take hours to trawl through. The team supporting the Kubernetes platform at Civo needed a solution that was simple and performant and could be queried in ways to help and not hinder them In this talk, Civo SRE Anaïs Urlichs and Principal Engineer Alex Jones will illustrate how Loki was chosen and brought into the organization to empower engineers. Integrating with Prometheus and Grafana dashboards, Loki has allowed engineers to filter for precise information that helps them debug quicker.

New in Grafana Loki 2.4: The Simple Scalable Deployment Mode

New in Grafana Loki 2.4: The Simple Scalable Deployment Mode This mode is a bridge between running Loki as a single binary/monolithic mode and full-blown microservices. The idea is to give users more flexibility in scaling and provide the advantages of separating the read and write path in Loki. Command to run the flog log generator: Start correlating your data with Grafana Cloud and the new FREE tier.

Simple, scalable deployment for Grafana Loki and Grafana Enterprise Logs

Loki 2.4 and GEL 1.2 introduced a hybrid deployment model that takes the simplicity of running the Loki log aggregation solution as a single binary and introduces an easy path to high availability and scalability. Particularly for organizations running on virtual machine and bare metal (non-Kubernetes) environments, this is a game-changer! Learn more in this tutorial from Grafana Labs Senior Software Engineer Trevor Whitney.

Making data accessible with sound, a Grafana Labs Hackathon project by Kostas Pelelis

We learned from a visually impaired astronomer that it was possible to use sonification to understand astronomical spectra. So during a hackathon at Grafana Labs we decided to turn time series into audio, and add sound to our alerting systems too. Kostas Pelelis is a Software Engineer at Grafana Labs living in Greece.

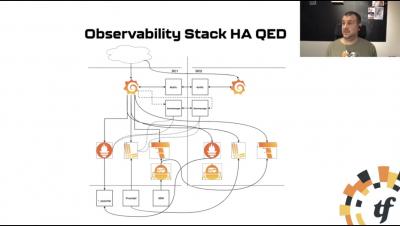
Bootstrapping a multi DC cloud native observability stack by Bram Vogelaar

An introduction to Observability and how to setup a highly available monitoring platform, across multiple data centers. During this talk we investigate how to config a monitoring setup across 2 DCs using Prometheus, Loki, Tempo, Alertmanager and Grafana. Bram Vogelaar spent the first part of his career as a Molecular Biologist, he then moved on to supporting his peers by building tools and platforms for them with a lot of Open Source technologies. He now works as a DevOps Cloud Engineer at The Factory.

Testing with k6 + Grafana: Better together by Nicole van der Hoeven

k6 is one of the newest additions to the Grafana Labs family, but what exactly is it, and what does it have to do with Grafana? In this session, Nicole van der Hoeven will demonstrate how to use k6, how to integrate it with Grafana, and why k6 and Grafana are better together. Nicole van der Hoeven is a Developer Advocate at k6, living in the Netherlands.

Tales of A11y In Grafana OS: Introducing Pa11y CI into our pipeline by Alexa Vargas

We want to make Grafana accessible to everyone! In this talk, Alexa will share how Grafana recently introduced Pa11y CI into the Grafana Continuous Integration pipeline. The library supports our developers and contributors to highlight a11y issues. And more importantly, it acts as a gatekeeper, stopping new A11y issues from making it into the project. You will additionally hear about the alternatives that were considered and their challenges. This talk will have everything!

Using Thanos to gain a unified way to query over multiple clusters by Wiard van Rij

When using Thanos on top of Prometheus we can leverage this for a unified way in a single data source to query all our data across multiple clusters, servers and Prometheis. Wiard van Rij is an Engineer at Fullstaq helping people, teams, and organizations with various cloud-native challenges with a strong focus on Kubernetes and Observability. Wiard is a Thanos team member, open source enthusiast and has extra fun with security and hacking.

Query your nginx/envoy/syslog logs easier and way faster with the new Grafana Loki pattern parser.

Loki 2.3 introduces the pattern parser. Patterns are way simpler to write than Regex. As an added bonus, it's an order of magnitudes faster than the Loki regex parser. This means that you can now query way more semi-structured logs (nginx/envoy/syslog and more) in less time than before.

WTF! Migrating to Grafana's wide time series format presented by Stephanie Closson

The wide time series format was introduced in Grafana 7.5, and has been the standard for time series data since. This new format does not work well with older panels though. WTF? Learn how to spot time series format issues, and solve them. Presented by Stephanie Closson, Software Engineer at Grafana Labs at Grafana East Coast Virtual Meetup - August 2021