Operations | Monitoring | ITSM | DevOps | Cloud

Latest Videos

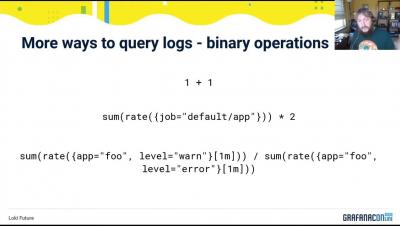
GrafanaCONline: Loki future

It has been two years since Tom Wilkie and David Kaltschmidt created the design doc that kickstarted the Loki project. In this presentation we will go back in time and talk about the original design for Loki and then compare/contrast that with where the project is today. We will then spend some time talking about the future plans for Loki, what some long term goals and non-goals are, what features we would like to add, and highlight the active discussion and plans for the LogQL query language. Finally, we will close by talking about the difficult and often controversial topic of monetizing open source projects – confirming our commitment to Loki open source while explaining our Hosted Loki and Loki Enterprise.

GrafanaCONline: Chrome browsing data to Grafana - as you browse

This session covers using variables to combine weather records and forecasts to measure a beehive – and how this can help beekeepers. We’ll also show how to compare particulate-matter (PM) measurements of nearby stations from different networks and develop a humidity-correction for low-cost PM sensors within a Grafana dashboard.

GrafanaCONline: What's the bee-weather & how to correct particulate-matter readings

This session covers using variables to combine weather records and forecasts to measure a beehive – and how this can help beekeepers. We’ll also show how to compare particulate-matter (PM) measurements of nearby stations from different networks and develop a humidity-correction for low-cost PM sensors within a Grafana dashboard.

GrafanaCONline: Tanka: Declarative Dashboards for Declarative Clusters

Tanka is a powerful tool for managing Kubernetes resources using the Jsonnet language. Along with a demonstration of deploying Grafana to Kubernetes using Tanka, this session will cover the benefits of deploying your dashboards alongside your code, how to manage Kubernetes resources using Tanka and Jsonnet, and how to create dashboards using Grafonnet and deploy them with Tanka.

GrafanaCONline: Nissan Leaf -> cloud all the things

Come join me on an adventure to analyze and improve my driving behavior and driving routes to get the most range out of my all-electric Nissan Leaf. You will get to see how you can use Grafana, Cortex, Loki, and other amazing open source technologies on a $35 Raspberry Pi to process and store over 1000 messages/second from the vehicle CAN bus along with GPS data and even camera images!

GrafanaCONline: Slicing Kubernetes: Raspberry Pis, monitoring and chaos

Do you ever feel like your systems lack unnecessary complexity and overengineering? This is the talk for you. Join me as I detail the creation of a Raspberry Pi-based desktop Kubernetes cluster in an attempt to overcomplicate the already complex world of stateless web application deployment. We’ll walk through building an observability platform using open source tools like Prometheus, Grafana, and Jaeger to keep a close watch on our tiny fragile microservices and then break them intentionally for our own amusement.

GrafanaCONline: Industrial process monitoring: oil and gas industry

We have been utilizing Grafana at Whiting Oil and Gas for approximately three years. In that time, we have greatly impacted the way our field assets are managed through dashboards and alerting. Instead of servers and network data, Whiting is using the application to monitor oil and gas wells in remote locations. Historically, the energy industry has deployed very expensive tools to monitor assets and visualize data.