Operations | Monitoring | ITSM | DevOps | Cloud

Latest Videos

JFrog Log Analytics with Splunk

The JFrog Platform’s unity is powered by many microservices, each with its own log record. When even a small enterprise JPD might record millions of transaction events each day, operators need to be able to connect that data to a powerful analytics tool that can help find insights. JFrog now offers some tools that make that much easier to do, through the analytics and visualization tool you already use.

JFrog Log Analytics with Elasticsearch And Kibana

The JFrog Platform’s unity is powered by many microservices, each with its own log record. When even a small enterprise JPD might record millions of transaction events each day, operators need to be able to connect that data to a powerful analytics tool that can help find insights. JFrog now offers some tools that make that much easier to do, through the analytics and visualization tool you already use, including users of Elastic Stack.

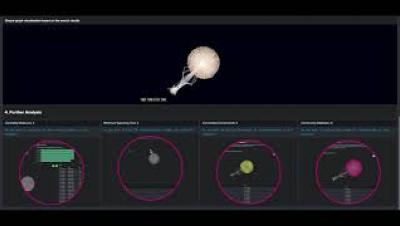
Graph Analytics Using Splunk and the Machine Learning Toolkit

Almost all data in Splunk can be turned into graphs, and that's possibly something you may not have considered before. In your network traffic data, a source IP connects to a destination IP with attributes like bytes in/out, packets, ports, and other properties. Users log into an interconnected stack of systems, services, devices and applications which are connected with each other. Transactions run from A to B to C and may describe a process that helps you analye user journeys and business processes in general.

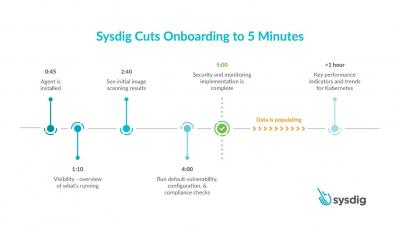
5 minutes to onboard secure DevOps

Today, we are excited to announce a faster onboarding for Kubernetes visibility and security. With the SaaS-first approach and new enhancements to the Sysdig Secure DevOps Platform, you can get results after just a five-minute setup. This release includes a new guided onboarding process, out-of-the-box dashboards as part of curated essential workflows, and a new Sysdig Essentials tier.

Using Cloud Logging on GKE

Looking to debug and troubleshoot your workloads that are on Google Kubernetes Engine? In this episode of Stack Doctor, Yuri Grinshteyn shows you how Cloud Logging ingests your GKE workloads, and what tools allow you greater observability over log data. Watch to learn how you can efficiently retrieve, view, and analyze logs from your queries with Cloud Logging!

Cloud logging

There’s no tool that can replace the best practices for DevOps or SRE, but there is a tool that can allow you greater observability over your logs in a distributed infrastructure involving multiple products. In this episode of Google Cloud Platform Essentials, we show you how logs are aggregated for all Google Cloud products, how to utilize them, and how to use them for tracking application errors.