Operations | Monitoring | ITSM | DevOps | Cloud

%term

How to View Usage Report and Logs | AirDroid Remote Support Guide

Learn how to easily view usage reports and logs in AirDroid Remote Support to keep track of your remote sessions. In this step-by-step guide, we’ll show you how to access detailed reports and activity logs, helping you monitor remote support activities, troubleshoot issues, and optimize your remote assistance workflow.

What IS CIDR? Everything You Need to Know About This IP Addressing Method

Managing IP addresses is essential in the operation and security of modern computer networks. However, the original IP addressing system based on address classes A, B, and C was extremely inefficient in allocating addresses. Many addresses were wasted, rapidly depleting the available IPv4 space. To address this pressing issue, Classless Inter-Domain Routing (CIDR) was introduced in 1993. So, if you’re wondering what is CIDR, read on to learn everything you need to know.

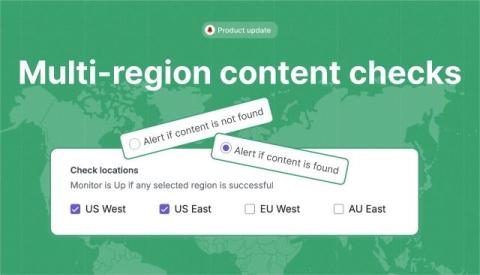
Website content checks are now multi-region!

We’ve made an upgrade to the “Check for Content” feature in our website monitors! Previously, users could select just one location at a time from US West, US East, EU West, and AU East via radio buttons. Now you can monitor your content from multiple locations instead of just one. By choosing multiple regions you can ensure that transient network issues don’t cause your monitor to go down unexpectedly.

Revolutionize your Backup Strategy with NinjaOne Image Backup

As IT environments continue to gain complexity and data is growing exponentially, protecting your IT infrastructure and data is also gaining complexity. A strong backup plan that includes image backup is key. Image backups help restore a device and its data in the event a rebuild is required. They can also be used to restore data to another machine in case of a disaster.

Query Language Not Required! Explore Apps Suite Demo (Logs, Metrics, Traces, Profiles) | Grafana

This talk dives into making observability more accessible with Grafana’s Explore apps suite. This new experience, which includes eliminates the need to write queries as you visualize and explore your data. Explore Metrics and Explore Logs (both GA), simplify navigating Prometheus and Loki data with an intuitive UI, eliminating the need to write queries in PromQL or LogQL. They come with improvements like better related metrics recommendations, OpenTelemetry logging support, and enhanced pattern detection.

Set Up Links Between Data Sources With the New Correlations Feature | Demo | Grafana 11.3

Correlations is a feature that allows Grafana users to set up links between their data sources. Previously, the link generated would only be from one query to another—meaning results from a query could only generate links to open a second Explore pane with other query results. With this feature, users can now link to third party web-based software based on their search results. The format follows the standard Grafana format for using variables. This is generally available in all editions of Grafana.

Why Quality Matters: A Conversation with NDepend

In this episode of Founder & Friends, John-Daniel Trask, co-founder and CEO of Raygun, sits down with Patrick Smacchia, Founder and CEO of NDepend, to share their stories and strategies for building excellent software. They discuss the intricacies of the.NET ecosystem, strategies for sustaining high-quality software, and the evolution of development tools. Gain insights into NDepend's methods for managing dependencies, refining code, and optimizing performance. This episode is essential for developers aspiring to advance their technical abilities and produce superior software.