Operations | Monitoring | ITSM | DevOps | Cloud
%term
New Feature Spotlight: Notification Attachments
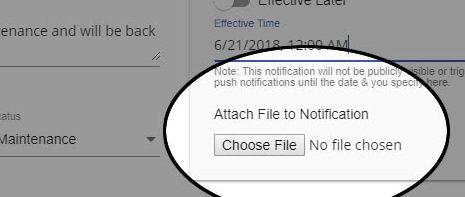
Continuing deeper exploration of some of our exciting new features, today I’ll be presenting Notification Attachments and demonstrating how your status page can, once again, hopefully make your job a little easier. We recently had a customer ask: “Is there a way to show a maintenance page instead of [just] an icon if the web services are down?”. Further investigation revealed he was looking for the ability to provide more information to his users regarding the nature of a system outage.
Location, Location, Location.
StatusGator has a few thousand users. Recently I grew curious as to where you all are. Surely it would be interesting to learn a little about where they are from. The results are pretty interesting. I’m pleased to report StatusGator helps users in 85 different countries!
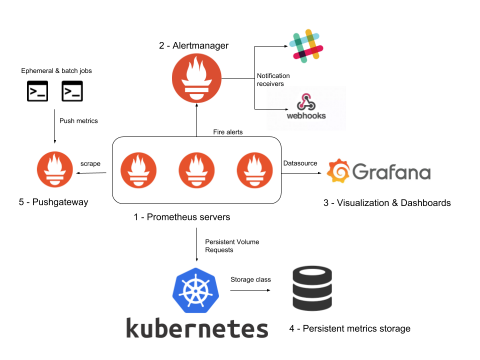
Kubernetes Monitoring with Prometheus: AlertManager, Grafana, PushGateway (part 2).
A complete ‘Kubernertes monitoring with Prometheus’ stack is comprised of much more than Prometheus servers that collect metrics by scraping endpoints. To deploy a real Kubernetes and microservices monitoring solution, you need many other supporting components including rules and alerts (AlertManager), a graphics visualization layer (Grafana), long term metrics storage, as well as extra metrics adapters for the software that is not compatible out of the box.
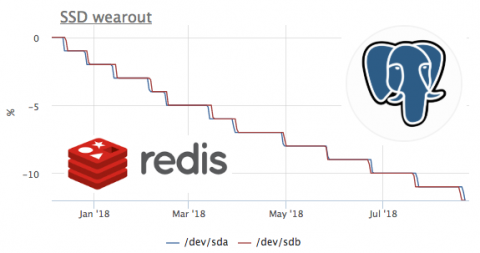
Real world SSD wearout
A year ago we’ve added SMART metrics collection to our monitoring agent that collects disk drive attributes on clients servers. So here a couple of interesting cases from the real world.
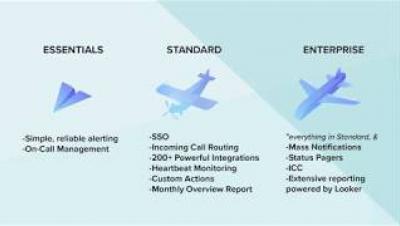
OpsGenie: Which Plan is Right for You?
Exception Perceptions: Turning C# into a 5-Star Mobile App with Xamarin
On this episode of Exception Perceptions, Xamarin + Azure Cloud Developer Advocate Brandon Minnick stopped by to chat with Sentry’s Developer Evangelist(a) Chloe Condon about Visual Studio Tools for Xamarin the mobile development platform that lets developers use their C# and .NET skills to build fully native Android, iOS, and UWP apps.
Simplifying security auditing, Part 3: Keeping insider threats in check
Insider threats are on the rise. In fact, both administrators and average employees are among the biggest security threats in an organization. When it comes to security auditing, there are two areas you need to focus on: Active Directory changes and individual user activity, particularly administrator activity.
How to choose kubernetes deployment platform
These are some of the most important points while choosing kubernetes deployment platform.


