Operations | Monitoring | ITSM | DevOps | Cloud


SigNoz

Getting started with OpenTelemetry on Kubernetes
OpenTelemetry is an instrumentation standard for application monitoring - both for monitoring metrics & distributed tracing. In this blog, we take you through a hands on guide on how to run this on Kubernetes.

Distributed tracing using Jaeger with Cassandra
With microservices becoming popular, tracing is increasingly more important in debugging production software. In this post, we take you through a step by step guide on setting up Jaeger over Kubernetes with Cassandra storage.

Why are we building SigNoz?
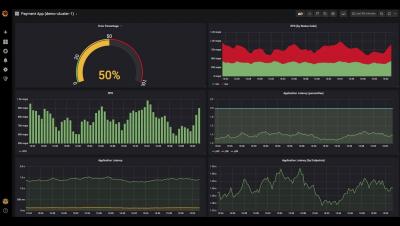
I am sure most of you have come across this situation. You liked something on the Internet, decided to buy it and made the payment at the payment gateway. After that you expect to come to the original website and see a confirmation message. Something of the sort 👇

Setting up HA Prometheus with Cortex and Cassandra
In this blog, we explain how we enable high availability Prometheus using Cortex and Cassandra. This provides a single pane of view across multiple clusters - which enables visualising all monitoring metrics in one go.
SigNoz Demo - Monitoring for MultiCluster Kubernetes

Bringing out of the box application monitoring to Prometheus
Prometheus is undoubtedly growing as the native monitoring tool for Kubernetes. We have been using Prometheus to collect metrics about our infrastructure for a long, but setting it of the box is still painful.

My 7 key takeaways from PromCon 2019
PromCon is one of the premier conference on Prometheus and related tools like Grafana. This is held every year where developers from around the world gather to learn the latest in monitoring technologies.

Quantile Aggregation for statsd-exporter in Prometheus
In this blog, we shall send observation frequencies in the bucket intervals chosen and aggregate those at the Prometheus back-end.

Monitoring Tools: Comparing Instana and Sysdig
In this blog, we compare Instana and Sysdig - two popular monitoring tools which claim to show APM metrics without need to instrument code.