Operations | Monitoring | ITSM | DevOps | Cloud

%term

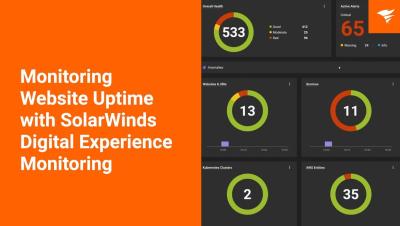
Monitoring Website Uptime with SolarWinds Digital Experience Monitoring

Learn how to set up availability monitoring in SolarWinds Observability's Digital Experience Monitoring (DEM). This step-by-step guide walks you through configuring synthetic probes, setting monitoring intervals, and enabling SSL certificate tracking. Ensure your website is monitored from multiple regions and be alerted to potential issues before they affect your users.

What is Network Monitoring? Tools, Strategies, and Benefits Explained

Have you ever faced a situation where a sudden network outage or slowdown impacted your workday, leaving you wondering what could have been done to prevent it? Along with the many frustrations and risks that come with network downtime, this common scenario illustrates the importance of staying one step ahead in managing your network health. But what is network monitoring, and how can it help you address issues before they escalate into major disruptions?

Keeping your code secure in the cloud

In this blog, we walk through Atlassian's cloud security practices and the controls we give you inside Bitbucket to maintain enterprise-grade security, without the overhead of managing it internally. Security is an essential part of Atlassian's offerings. We manage code and data for over 300,000 customers who serve hundreds of millions of users. To secure data at the scale we operate, we invest more in security than most individual organizations can.

How Telemetry Data Can Improve Your Operations

Telemetry data, at its core, is all about transmitting real-time information from remote sources to centralized systems for analysis and action. This data is super important across different industries due to its ability to provide immediate, actionable insights that enhance operations and strategic decision-making.

Lower observability bills, reduced MTTR, and more: why companies migrate to Grafana Cloud

There are a lot of factors that go into choosing an observability solution. And even after all that careful consideration, sometimes the platform you initially invest in doesn’t meet your needs, especially as your organization grows and evolves. For that very reason, we’ve seen users begin their observability journeys with another tool, and then decide to migrate to Grafana Cloud, our fully managed cloud-hosted observability platform.

Azure Machine Learning Pricing - 2024 Guide to ML Costs

Undoubtedly, AI is our future—which means it’s past time to integrate machine learning models into your FinOps multi-cloud tech stack. AI turns simple tasks into something that can be executed at the click of a button. With well-trained models, FinOps, MSPs, and Enterprises can automate cost detection, forecasting, and anomaly identification, streamlining complex financial operations without increasing their workforce. The good news?

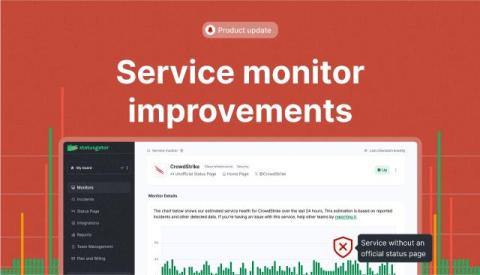
Service monitor improvements: Unofficial services, health graphs, and more

We’re excited to show you some great updates to the most-used feature of StatusGator: Third party service monitoring. This update combines several features that have been very often requested and will certainly make your StatusGator experience even better. Here’s what’s new.