Operations | Monitoring | ITSM | DevOps | Cloud

Dashboards

Viewing LogicMonitor Reports Within Dashboards

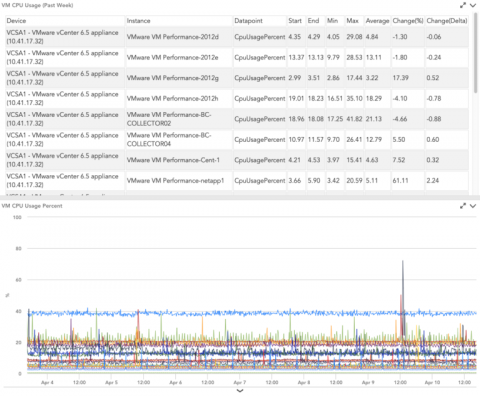
As a Sales Engineer, I hear interesting product requests on a daily basis, and integrating LogicMonitor reports with LogicMonitor dashboards comes up frequently. LogicMonitor's reporting engine has many useful functions from capacity planning to SLA calculation, and dashboards help users visually digest the raw data of reports.

Creating Custom Kibana Visualizations

As you may very well know, Kibana currently has almost 20 different visualization types to choose from. This gives you a wide array of options to slice and dice your logs and metrics, and yet there are some cases where you might want to go beyond what is provided in these different visualizations and develop your own kind of visualization.

A Kibana Tutorial: Getting Started

Kibana is the visualization layer of the ELK Stack — the world’s most popular log analysis platform which is comprised of Elasticsearch, Logstash, and Kibana. This tutorial will guide you through some of the basic steps for getting started with Kibana — installing Kibana, defining your first index pattern, and running searches. Examples are provided throughout, as well as tips and best practices.

How PostgreSQL and Grafana Can Improve Monitoring Together

TimescaleDB is an open source database packaged as a Postgres extension that supports time series, but “it looks as if it were just Postgres,” said Timescale’s Head of Product, Diana Hsieh. “So you can actually use the entire ecosystem. You can use all of the functions that are enabled in Postgres – like JSON indexes, relational tables, post JSON – and they all work with Timescale.”

Grafana Labs at KubeCon: Awesome Query Performance with Cortex

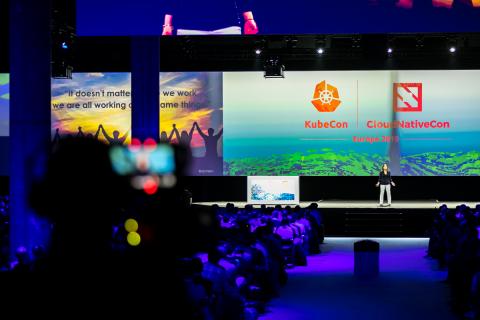
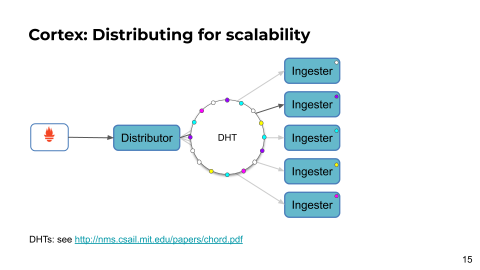
At KubeCon + CloudNativeCon in Barcelona last week, Weaveworks’ Bryan Boreham and I did a deep-dive session on Cortex, an OSS Apache-licensed CNCF Sandbox project. A horizontally scalable, highly available, long term storage for Prometheus, Cortex powers Grafana Cloud’s hosted Prometheus. During our talk, we focused on the steps that we’ve taken to make Cortex’s query performance awesome.

Grafana Labs at KubeCon: Foolproof Kubernetes Dashboards for Sleep-Deprived On Calls

We’ve all been in the situation where suddenly you are the lone developer on call while everyone is out of pocket. Or in the case of Grafana Labs Director of UX David Kaltschmidt, his then business partner, Grafana Labs VP of Product Tom Wilkie, was checking out for a weekend music fest. “Tom and I founded a company a couple of years ago, and I’m more of a frontend person. Tom did all the backend and devops stuff,” explained Kaltschimdt.

Grafana Labs at KubeCon: The Latest on Cortex

Grafana Labs has been running Cortex for more than a year to power Hosted Prometheus in Grafana Cloud. We’re super happy: It’s been incredibly stable and has recently gotten insanely fast. Here’s what you need to know about Cortex, what we’ve been doing to Cortex in the past year, and what we plan on doing in the coming months.