Operations | Monitoring | ITSM | DevOps | Cloud
%term
timeShift(GrafanaBuzz, 1w) Issue 58
This week we highlight articles featuring the ultimate guide to monitoring Kubernetes using Prometheus and Grafana, how to build effective dashboards, and a guide to help demystify PromQL.
Intro to Stackdriver - Take5
Best Practices for Business Service Monitoring
Monitoring microservices: Everything you need to know [2018]
Monitoring remains a critical part of managing any IT system, while the challenges associated with monitoring microservices are especially unique. An example is how traditional monolithic systems, deployed as a single executable or library, have different points of failure and dependencies than those deployed with a microservices architecture.
Monitor a Django app with Scout
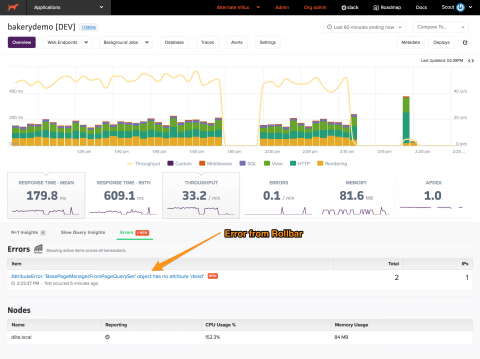
In this post, I'll show how to setup Scout to monitor the performance of SQL queries, external HTTP calls, template rendering, and more in Wagtail, a Django CMS app. Wagtail is a fast, modern opensource content management system built on Django. Used at NASA, Google, MIT, and more, it's a great option for running your own CMS. When we add the scout-apm package to the app, we'll quickly gain insights on the app's performance.
My One-person SaaS Side Project Celebrates its Third Birthday
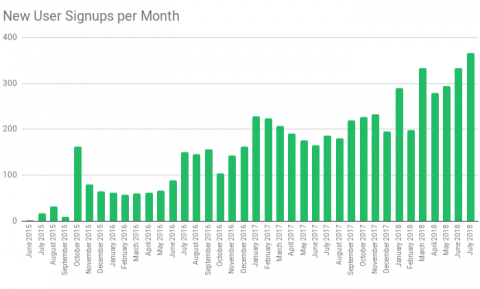
First, a TL;DR: on how much money I’m making. Healthchecks.io has around 90 paying customers, and the monthly revenue is a little above $700/mo. The bulk of that goes back into running costs.
What's new in Pandora FMS 7.0 NG 726
Among the new features of the new Pandora FMS 726 update package, you will find new templates to create visual consoles, improvements and views. A list of the most important changes is shown below.
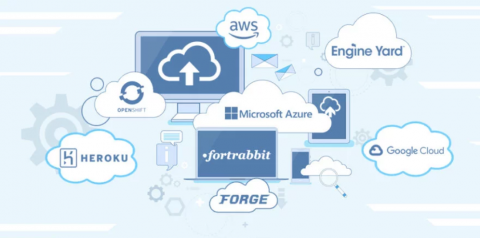
Top 8 PaaS Providers for Deploying PHP Applications
Platform as a Service (PaaS) is an innovative cloud computing model that helps to deliver applications over the web. In this model, a cloud provider offers hardware and software tools, typically those required for application development, to the users as a service. The cloud infrastructure provides the ability to efficiently and quickly design and deploy apps and have them functioning reliably. Typically, the platform functions as an enabler of cloud applications.


