Operations | Monitoring | ITSM | DevOps | Cloud

%term

Nathaniel Cook | KAPACITOR STREAM PROCESSING

Kapacitor is the brains of the TICK Stack. Nathaniel will cover the stream processing capabilities of Kapacitor, how to process data before it gets stored in InfluxDB and after it is stored, best practices around anomaly detection and machine learning. In addition, Nathaniel will discuss how to configure the clustered version of Kapacitor.

David Cromberge | WHY YOU DEFINITELY DON'T WANT TO BUILD YOUR OWN TIME SERIES DATABASE

At Outlyer, an infrastructure monitoring tool, we had to build our own TSDB back in 2015 to support our service. Two years later, we decided to take a different direction after seeing for ourselves how hard it is to build and scale a TSDB. This talk will review our journey, the challenges we hit trying to scale a TSDB for large customers and hopefully talk some people out of trying to build one themselves because it is not easy!

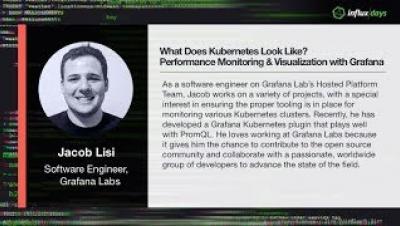
Jacob Lisi | WHAT DOES KUBERNETES LOOK LIKE?: PERFORMANCE MONITORING & VISUALIZATION WITH GRAFANA

Monitoring Kubernetes is vital to understanding the health and performance of a cluster, but which metrics are most important to add to your dashboards and alert on? Jacob will discuss how to most effectively monitor and visualize your Kubernetes cluster using the Grafana Kubernetes plugin and PromQL.

Paul Dix | INFLUXDATA PLATFORM FUTURE AND VISION

Paul will outline his vision around the platform and give the latest updates on IFQL ( a new query language), the decoupling of query and storage, the impact of hybrid cloud environments on architecture, cardinality, and discuss the technical directions of the platform. This talk will walk through the vision and architecture with demonstrations of working prototypes of the projects.

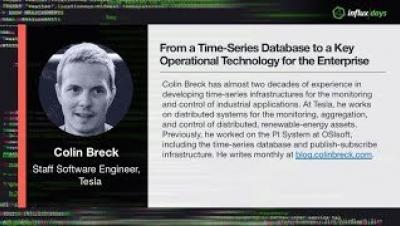
Colin Breck | FROM A TIME-SERIES DATABASE TO A KEY OPERATIONAL TECHNOLOGY FOR THE ENTERPRISE

It is important for a time-series database to provide efficient storage, aggregation, and query of time-series data. Elevating a time-series database to a core operational technology of the enterprise, however, involves so much more. In this talk, I will explore important considerations that take a time-series database from being just another data-store, to a critical infrastructure for operational intelligence.

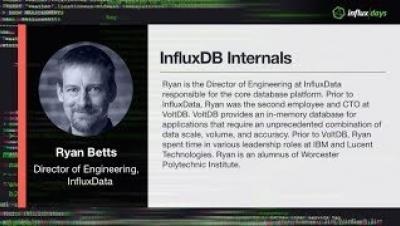
Ryan Betts | INFLUXDB INTERNALS

Ryan will expand on his popular blog series and drill down into the internals of the database. Ryan will discuss optimizing query performance, best indexing schemes, how to manage clustering (including meta and data nodes), the impact of IFQL on the database, the impact of cardinality on performance, TSI, and other internals that will help you architect better solutions around InfluxDB.

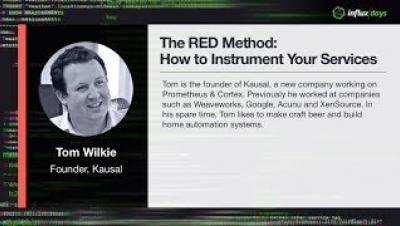
Tom Wilkie | THE RED METHOD: HOW TO INSTRUMENT YOUR SERVICES

In this talk, Tom Wilkie will discuss patterns of application instrumentation, where and when they are applicable, and how they can be implemented with Prometheus. He’ll cover Google’s Four Golden Signals, the RED Method, the USE Method, and Dye Testing. He’ll also discuss why consistency is an important approach for reducing cognitive load. Finally, he’ll talk about the limitations of these approaches and what can be done to overcome them.

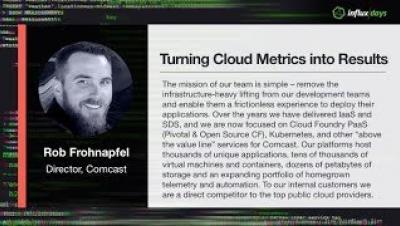
Rob Frohnapfel | TURNING CLOUD METRICS INTO RESULTS

You have discovered InfluxDB and now have a plethora of metrics at your fingertips. Next, you want to apply these metrics and generate impactful, tangible business results. But where do you start? This talk will describe how Comcast was able to apply our multi-tenant cloud metrics to identify huge opportunities, partner with the business, and drive outcomes that include reliable cloud performance and the return of real dollars to the business…not to mention happy customers!