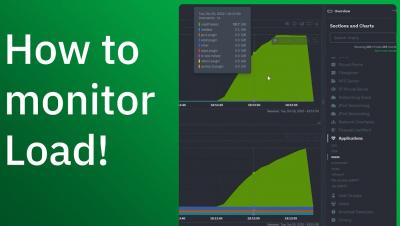
How to monitor server load
We often hear the term "load" used to describe the state of a server or a device. But what does it really mean? System load is a measure of the amount of computational work that a system performs. An overloaded system, by definition, isn't able to complete all its tasks per schedule - this affects the performance and productivity of the system. And while "load" often gets conflated with CPU usage there's a lot more to it.


