Operations | Monitoring | ITSM | DevOps | Cloud
%term
Combining Log Analysis with Continuous Delivery to Reduce Release Cycle Times
One of the biggest challenges in the field of log analysis is being able to connect the dots and understand the underlying story connecting them. Applications and machines are generating an increasing amount of log data, making it extremely difficult to separate the wheat from the chaff.
How to Integrate Datadog, Jira, and Slack with OpsGenie
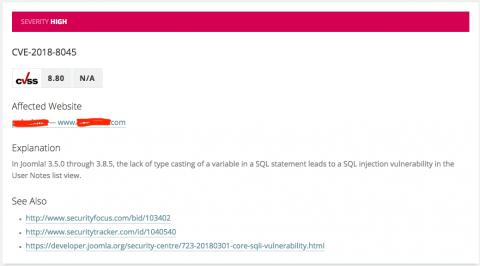
Joomla! CMS Vulnerability Scanner
WordPress may power the majority or the internet, but Joomla! is the second most popular CMS on the planet, representing 6.1% of all known CMS websites. So we felt it was important to integrate it directly into our external website security and vulnerability scanner. Sitting alongside special checks for WordPress, Drupal and SilverStripe websites, we scan potential issues with the core version of Joomla! and any plugins installed.
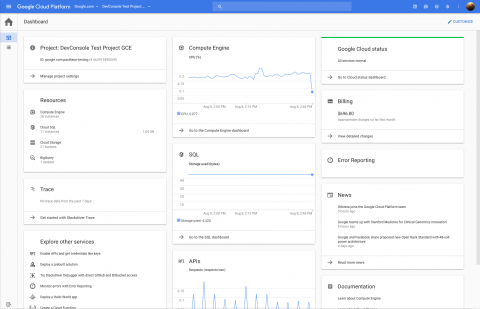
Announcing Stackdriver Kubernetes Monitoring: Comprehensive Kubernetes observability from the start
Today, we are excited to announce the beta release of Stackdriver Kubernetes Monitoring, which lets you observe Kubernetes in a comprehensive fashion, simplifying operations for both developers and operators.
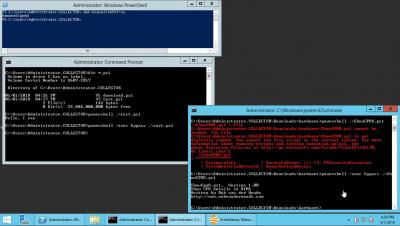
Terminating Malicious PowerShell Scripts
Announcing Stackdriver Kubernetes Monitoring: comprehensive Kubernetes observability
Icinga Monthly Snap April: Berlin Meetup, Releases and Themes
April brought us new bugfix releases of Icinga 2 v2.8 and Icinga Web v2.5. Carsten released new versions for the Grafana module for Icinga Web 2.
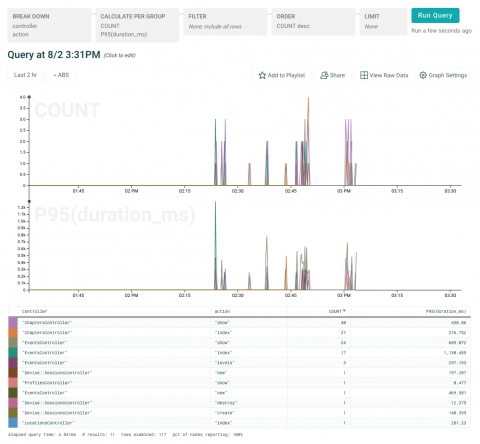
Instrument Your Rails Apps Automatically With Honeycomb's New Rails Integration
You’ve always been able to get observability for your Ruby apps by instrumenting them with our SDK, affectionately known as libhoney. Unfortunately, instrumenting code you’ve already written is nobody’s favourite job. If only there were some way to automate the repetitive parts, so you could get instant insight into what your app is doing in production, and then focus your effort on augmenting that insight with the information that’s unique to your app!


