Coralogix Deep Dive - How to Save Between 40-70% with the TCO Optimizer
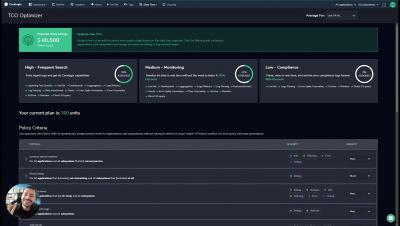
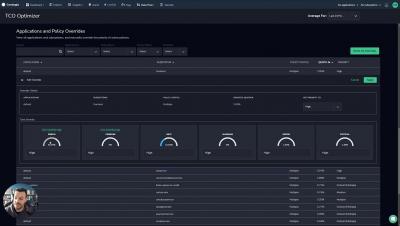
The TCO Optimizer is a key feature in the Coralogix cost optimization suite. Coralogix customers regularly see cost savings of between 40 and 70%, when compared to the prices quoted by the competition. With intelligent use of the TCO Optimizer, Coralogix even becomes more cost effective than a self-hosted ELK stack.