Operations | Monitoring | ITSM | DevOps | Cloud

Grafana

Grafana Plugin Tutorial: Polystat Panel (Part 1)

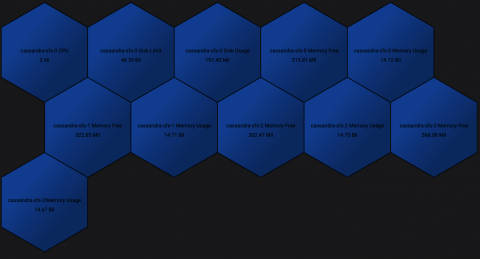
The grafana-polystat-panel plugin was created to provide a way to roll up multiple metrics and implement flexible drilldowns to other dashboards. This example will focus on creating a panel for Cassandra using real data from Prometheus collected from our Kubernetes clusters. We’ll focus on the basic metrics for CPU/Memory/Disk coming from cAdvisor, but a well-instrumented service will have many metrics that indicate overall health, such as requests per second, error rates, and more.

Everything You Need to Know About the OSS Licensing War, Part 2.

Where we left off: AWS had taken the Elasticsearch software and launched their own cloud offering in 2015, and Elastic N.V. had doubled down on an “open core strategy.” Once AWS decides to offer a project like Elasticsearch, it immediately becomes a truly formidable competitor to anyone trying to do the same, even the company behind the software itself. AWS has huge scale, operational expertise, and various network effects that really compound.

Tinder & Grafana: A Love Story in Metrics and Monitoring

Tinder is the world’s most popular dating app, with more than 26 million matches made each day. But two years ago, when it was time for the L.A.-based company to find and implement a perfect metrics monitoring partner, the process proved to be more slow-burn love affair versus whirlwind romance.

Pro Tips: How Booking.com Handles Millions of Metrics Per Second with Graphite

More than 1.55 million room nights are reserved on the Booking.com platform every day. It’s a staggering amount of traffic, and not surprisingly, the Amsterdam-based travel e-commerce company has a lot of knowledge to share about handling metrics at scale.