Operations | Monitoring | ITSM | DevOps | Cloud
%term
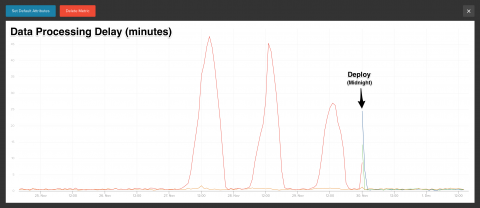
This Week's Data Processing Lag
This week at Skylight HQ (technically it’s in the Cloud somewhere), we were hit with a pretty big surge of requests on our collector (Cyber Monday perhaps?). Fortunately our backend is architected to handle a very large volume of data from the agents with minimal latency, so this kind of surge on our backend would not affect the performance of your apps in any way (in addition, the agent is sending data in the background from a different process separate from your app/server).
Receive huge website monitoring discounts!
Website monitoring discounts are now available.
Manage incident notifications with alert toggling
Letting the right people know about incidents is an easier-said-than-done kind of task. Every incident is different and some notifications simply don’t need to land in everyone’s inbox. We’ve listened to a lot of customers who like the idea of posting an incident to their status page, but not having that incident sent as notifications to all their subscribers.
Prometheus Tutorial
Prometheus Monitoring Tutorial
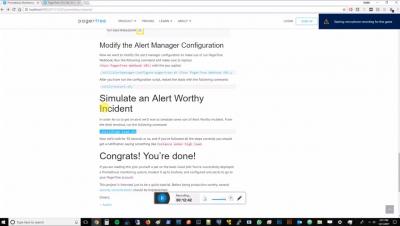
In this post, I will walk you through creating a simple Prometheus monitoring stack, connecting it to Grafana for pretty dashboards, and finally configuring alerts via PagerTree.
re:Invent Highlights-Day Three
As re:Invent continues, so to does the string of announcements promising to change the face of cloud computing. Many of the major announcements today came from Amazon itself — amongst other items, AWS announced two new containerized cloud offerings.
Major Client Update For Elixir
This month we released a new version of our hex package, which includes a major refactor of the internal client logic as well as some new features, improvements, and bug fixes. We're super excited to share the release of honeybadger v0.7 with you! Here are the highlights.
Negative Impact of Website Downtime
There are millions of reasons why sites go down. It could be an equipment malfunction or server overload. You might also experience data center problems, or you were just careless enough to forget to renew your domain name. Even worse, your site could be a hacker victim. Regardless of the cause, you need to resolve the problem as soon as it starts, because downtime can hurt your business.


