Operations | Monitoring | ITSM | DevOps | Cloud
NodeJS Instrumentation - Creating Custom Spans for Method-Level Visibility | Datadog Tips & Tricks
NodeJS Instrumentation - Capturing Performance of External Services | Datadog Tips & Tricks
NodeJS Instrumentation - Adding Analyzed Spans for Improved Data Analytics | Datadog Tips & Tricks
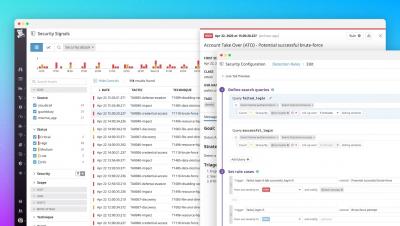
Datadog Security Monitoring
How to Set up APM Manual Instrumentation for your Python Application | Datadog Tips & Tricks
OpenShift monitoring tools
In Part 1 of this series, we looked at the key observability data you should track in order to monitor the health and performance of your Red Hat OpenShift environment. Broadly speaking, these include cluster state data, resource usage metrics, and information about cluster activity such as control plane metrics and cluster events. In this post, we’ll cover how to access this information using tools and services that come with a standard OpenShift installation.
Key metrics for OpenShift monitoring
Red Hat OpenShift is a Kubernetes-based platform that helps enterprise users deploy and maintain containerized applications. Users can deploy OpenShift as a self-managed cluster or use a managed service, which are available from major cloud providers including AWS, Azure, and IBM Cloud. OpenShift provides a range of benefits over a self-hosted Kubernetes installation or a managed Kubernetes service (e.g., Amazon EKS, Google Kubernetes Engine, or Azure Kubernetes Service).
OpenShift monitoring with Datadog
In Part 1, we explored three primary types of metrics for monitoring your Red Hat OpenShift environment: We also looked at how logs and events from both the control plane and your pods provide valuable insights into how your cluster is performing. In this post, we’ll look at how you can use Datadog to get end-to-end visibility into your entire OpenShift environment.
Use Template Variables to Create Dynamic Monitor Notifications
Identify and Alert on Slowest Running Queries with App Analytics
Configuring a Custom Agent Check to Run on IoT Devices (Raspberry Pi) | Datadog Tips & Tricks
Using Log Patterns to Discover Grok Parsing Rules | Datadog Tips & Tricks
How to Compare Metrics in Amazon CloudWatch and Datadog | Datadog Tips & Tricks
Modifying a Span Using Hooks - an Example in Node.js
Monitor Cisco Meraki with Datadog
Cisco Meraki provides a range of IT infrastructure devices—like network security appliances, switches, and wireless access points. As your on-prem infrastructure grows and you add potentially thousands of Meraki devices to your network, it becomes a challenge to get visibility across your entire fleet of devices.
Monitor ECS applications on AWS Fargate with Datadog
AWS Fargate allows you to run applications in Amazon Elastic Container Service without having to manage the underlying infrastructure. With Fargate, you can define containerized tasks, specify the CPU and memory requirements, and launch your applications without spinning up EC2 instances or manually managing a cluster. Datadog has proudly supported Fargate since its launch, and we have continued to collaborate with AWS on best practices for managing serverless container tasks.
Modifying a Span Using Hooks -- an Example in Node.js
Track and Monitor Datadog Account Usage using Dashboards
Monitoring Kafka performance metrics
Kafka is a distributed, partitioned, replicated, log service developed by LinkedIn and open sourced in 2011. Basically it is a massively scalable pub/sub message queue architected as a distributed transaction log. It was created to provide “a unified platform for handling all the real-time data feeds a large company might have”.Kafka is used by many organizations, including LinkedIn, Pinterest, Twitter, and Datadog. The latest release is version 2.4.1.
Collecting Kafka performance metrics
If you’ve already read our guide to key Kafka performance metrics, you’ve seen that Kafka provides a vast array of metrics on performance and resource utilization, which are available in a number of different ways. You’ve also seen that no Kafka performance monitoring solution is complete without also monitoring ZooKeeper. This post covers some different options for collecting Kafka and ZooKeeper metrics, depending on your needs.
Monitoring Kafka with Datadog
Kafka deployments often rely on additional software packages not included in the Kafka codebase itself—in particular, Apache ZooKeeper. A comprehensive monitoring implementation includes all the layers of your deployment so you have visibility into your Kafka cluster and your ZooKeeper ensemble, as well as your producer and consumer applications and the hosts that run them all.
Monitor Jenkins jobs with Datadog
Jenkins is an open source, Java-based continuous integration server that helps organizations build, test, and deploy projects automatically. Jenkins is widely used, having been adopted by organizations like GitHub, Etsy, LinkedIn, and Datadog. You can set up Jenkins to test and deploy your software projects every time you commit changes, to trigger new builds upon successful completion of other builds, and to run jobs on a regular schedule.


