Operations | Monitoring | ITSM | DevOps | Cloud
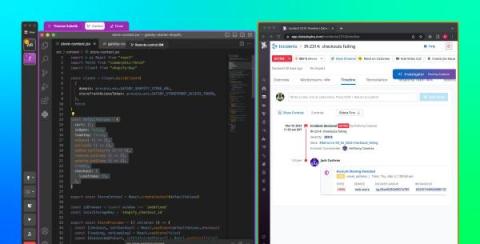
More efficient pair programming with Datadog CoScreen
Pair programming is a well-established practice in agile software development. But it can be difficult in remote settings, as most remote collaboration tools don’t accommodate real-time, spontaneous interactivity among participants’ desktop environments. Datadog CoScreen changes that by combining interactive screen sharing and video conferencing in a way that closely mimics in-person collaboration.
Monitor your Azure Arc hybrid infrastructure with Datadog
In today’s modern digital environment, many organizations are architecting their infrastructure and services around a mix of cloud and on-prem solutions. Both cloud and private servers offer unique benefits, and taking a hybrid approach to infrastructure can allow businesses to better meet user demand on a global scale while expanding capabilities, minimizing risk, and keeping services consistent.
Monitor Calico with Datadog
Calico is a versatile networking and security solution that features a plugable dataplane architecture. It supports various technologies, including Iptables, eBPF, Host Network Service (HNS for Windows), and Vector Packet Processing (VPP) for containers, virtual machines, and bare-metal workloads. Users can employ Calico’s network security policies to restrict traffic to and from specific clusters handling customer data and to quickly block malicious IP addresses during external attacks.
Datadog on Data Engineering Pipelines: Apache Spark at Scale
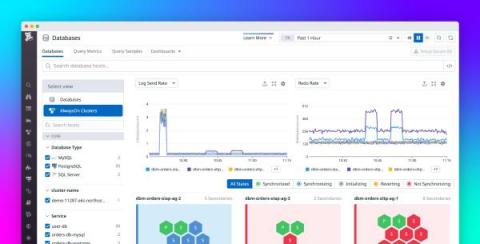
Monitor your AlwaysOn availability groups with Datadog Database Monitoring
SQL Server AlwaysOn availability groups provide database clusters that streamline automatic failovers and disaster recovery. With AlwaysOn clusters, you can leverage reliable, high-availability support for your services. However, AlwaysOn groups can be problematically complex, spread over servers and regions with multiple points of failure in each cluster. This makes it difficult to understand what’s happening in your groups at any given time and troubleshoot when issues occur.
Strategize your Azure migration for SQL workloads with Datadog
Migrating an on-prem database to a public cloud comes with a number of benefits, such as no longer needing to manage and maintain physical infrastructure, dynamic scaling, disaster recovery, and overall cost reduction. However, migrating to the cloud can often be a complex and daunting task. For instance, if an organization is a Microsoft shop with teams that rely on SQL Server databases, Azure is a natural fit for its needs.
Identify the root causes of issues and bottlenecks in your build pipelines with TeamCity and Datadog
TeamCity is a CI/CD server that provides out-of-the-box support for unit testing, code quality tracking, and build automation. Additionally, TeamCity integrates with your other tools—such as version control, issue tracking, package repositories, and more—to simplify and expedite your CI/CD workflows.
Practical tips for rightsizing your Kubernetes workloads
When containers and container orchestration were introduced, they opened the possibility of helping companies utilize physical resources like CPU and memory more efficiently. But as more companies and bigger enterprises have adopted Kubernetes, FinOps professionals may wonder why their cloud bills haven’t gone down—or worse, why they have increased.
Monitoring RabbitMQ performance with Datadog
In Part 2 of this series, we’ve seen how RabbitMQ ships with tools for monitoring different aspects of your application: how your queues handle message traffic, how your nodes consume memory, whether your consumers are operational, and so on. While RabbitMQ plugins and built-in tools give you a view of your messaging setup in isolation, RabbitMQ weaves through the very design of your applications.
Collecting metrics using RabbitMQ monitoring tools
While the output of certain RabbitMQ CLI commands uses the term “slave” to refer to mirrored queues, RabbitMQ has disavowed this term, as has Datadog. When collecting RabbitMQ metrics, you can take advantage of RabbitMQ’s built-in monitoring tools and ecosystem of plugins. In this post, we’ll introduce these RabbitMQ monitoring tools and show you how you can use them in your own messaging setup.
Key metrics for RabbitMQ monitoring
RabbitMQ is a message broker, a tool for implementing a messaging architecture. Some parts of your application publish messages, others consume them, and RabbitMQ routes them between producers and consumers. The broker is well suited for loosely coupled microservices. If no service or part of the application can handle a given message, RabbitMQ keeps the message in a queue until it can be delivered.
Why Glovo Chose Database Monitoring to Gain Context for Troubleshooting Issues
Why Restaurant Brands International Chose Datadog for Detailed Insights That Solve Problems
Why Seven.One Entertainment Group Chose Datadog RUM for Client-side Observability
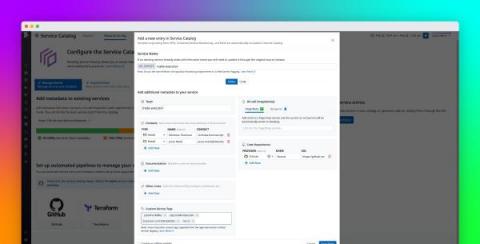
Easily add tags and metadata to your services using the simplified Service Catalog setup
Modern applications running on distributed systems often complicate service ownership because of their ever-growing web of microservice dependencies. This complication challenges engineers’ ability to shepherd their software through every stage of the development life cycle, as well as teams’ ability to train new engineers on the application’s architecture. With increased complexity, clarity is key for quick, effective troubleshooting and delivering value to end users.
Datadog On Reliability Engineering
Why Whatnot Chose Datadog Synthetic Monitoring to Automate Backend Testing
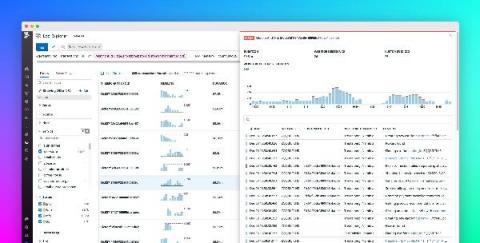
Analyze causal relationships and latencies across your distributed systems with Log Transaction Queries
Modern, high-scale applications can generate hundreds of millions of logs per day. Each log provides point-in-time insights into the state of the services and systems that emitted it. But logs are not created in isolation. Each log event represents a small, sequential step in a larger story, such as a user request, database restart process, or CI/CD pipeline.
Troubleshoot faulty frontend deployments with Deployment Tracking in RUM
Many developers and product teams are iterating faster and deploying more frequently to meet user expectations for responsive and optimized apps. These constant deployments—which can number in the dozens or even hundreds per day for larger organizations—are essential for keeping your customer base engaged and delighted. However, they also make it harder to pinpoint the exact deployment that led to a rise in errors, a new error, or a performance regression in your app.
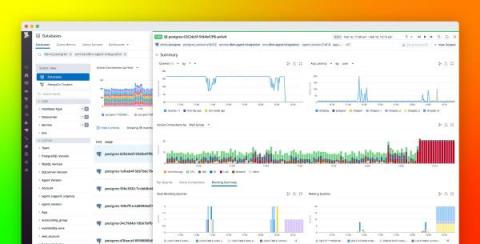
Troubleshoot blocking queries with Datadog Database Monitoring
Blocked queries are one of the key issues faced by database analysts, engineers, and anyone managing database performance at scale. Blocking can be caused by inefficient query or database design as well as resource saturation, and can lead to increased latency, errors, and user frustration. Pinpointing root blockers—the underlying problematic queries that set off cascading locks on database resources—is key to troubleshooting and remediating database performance issues.
How Delivery Hero uses Kubecost and Datadog to manage Kubernetes costs in the cloud
As the world’s leading local delivery platform, Delivery Hero brings groceries and household goods to customers in more than 70 countries. Their technology stack comprises over 200 services across 20 Kubernetes clusters running on Amazon EKS. This cloud-based, containerized infrastructure enabled them to scale their operation to support increasing demand as the volume of orders placed on their platform doubled during the pandemic.


