Operations | Monitoring | ITSM | DevOps | Cloud

March 2024

Best practices for monitoring software testing in CI/CD

A key challenge of monitoring your CI/CD system is understanding how to optimize your workflows and create best practices that help you minimize pipeline slowdowns and better respond to CI issues. In addition to monitoring CI pipelines and their underlying infrastructure, your organization also needs to cultivate effective relationships between platform and development teams.

Fine-tune observability configurations for all your Azure integrations in one place

Microsoft Azure provides an array of managed services to support many aspects of cloud computing, including application development, workload migration, and data management. To help you monitor the health and performance of these services, Datadog offers integrations with more than 40 Azure services, including Azure Kubernetes Service (AKS), Cosmos DB, and Azure App Services. Each integration provides robust data visualizations, meaningful alerts, and one-click Datadog Agent deployment.

Best practices for end-to-end service ownership with Datadog Service Catalog

In order to grow your organization effectively, you need to ensure the scalability of your systems. In a broad, distributed architecture, critical processes like incident triage, security response, and large-scale configuration changes can be difficult to execute without a programmatically accessible registry of what’s running in production and who owns it.

Simplify production debugging with Datadog Exception Replay

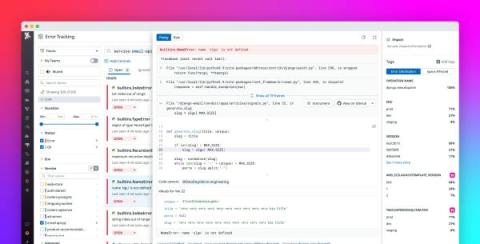
Debugging errors in production environments can frustrate your team and disrupt your development cycle. Once error tracking detects an exception, you then need to identify which specific line of code or module is responsible for the error. Without access to the inputs and associated states that caused the errors, reproducing them to find the root cause and a solution can be a lengthy and challenging process.

Integration roundup: Monitoring your container-native technologies

Container-native technologies increase the scalability and speed of deployment offered by containerized infrastructure, but they also present new monitoring challenges for organizations that adopt them. For example, because containers are ephemeral and share resources, tracking resource provisioning in container-native tools is essential to ensure consistent application performance.

Analyze multiple user journeys with the Datadog Sankey visualization

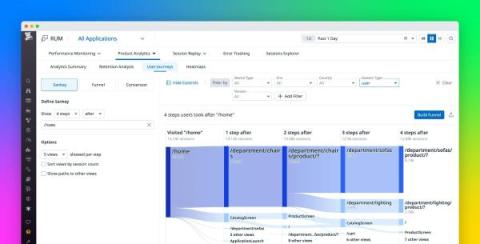
Funnels can be powerful tools for analyzing your UX, but figuring out exactly which user journeys you want to study can be challenging. Even if you have an ideal journey in mind, users often take steps you don’t expect. As a result, your funnels—and therefore, your optimization efforts—can easily miss the most influential pages in your application. Indeed, how do you build the best possible funnel when there are thousands of paths users can take after any given page?

Datadog on Data Science

In this episode we'll visit the world of predictive analytics and machine learning and uncover how these cutting-edge technologies are transforming the way Datadog monitors and improves its services. We’ll focus our conversation on two key aspects: using advanced statistical methods for proactive monitoring and the strategic implementation of machine learning for algorithm enhancement.

Apache Spark at Scale #datadog #shorts #security #observability

Datadog is an observability and security platform that ingests and processes tens of trillions of data points per day, coming from more than 22,000 customers. Processing that amount of data in a reasonable time stretches the limits of well known data engines like Apache Spark. In addition to scale, Datadog infrastructure is multi-cloud on Kubernetes and the data engineering platform is used by different engineering teams, so having a good set of abstractions to make running Spark jobs easier is critical.

Reduce context switching while troubleshooting with Datadog's IDE plugins

Visibility into the production performance of code iterations helps developers verify that application releases and updates are working as intended. However, when variables such as large-scale user requests and increased server load create issues that were absent during testing, developers will often need to pivot from investigating production data back to their coding environment to address errors and vulnerabilities.

How Complyt is using Datadog APM and distributed tracing to reduce application response times

Learn how Complyt is using Datadog Application Performance Monitoring (APM) and distributed tracing to turn data into knowledge and reduce application response times by more than 80%, which enabled them to meet SLAs for their largest customers.