Operations | Monitoring | ITSM | DevOps | Cloud

May 2024

How to export any Grafana visualization to a CSV file, Microsoft Excel, or Google Sheets

Grafana dashboards are a great way to combine a lot of technical information into one convenient picture. From time to time, it’s also useful to export data from a particular Grafana visualization to another format, so you can further analyze it and share it with others. In this blog post, we’ll walk through how to export CSV data for any Grafana visualization you use. This makes it easy to get that data into popular spreadsheet applications, such as Microsoft Excel or Google Sheets. =

Grafana Loki query acceleration: How we sped up queries without adding resources

As we discussed when we rolled out the latest major release of Grafana Loki, we’ve grown the log aggregation system over the past five years by balancing feature development with supporting users at scale. A big part of the latter has been making queries much faster — and that was a major focus with Loki 3.0 too. We’ve seen peak query throughput grow from 10 GB/s in our Loki 1.0 days to greater than 1 TB/s even before 3.0.

Grafana OnCall: Use the new bi-directional ServiceNow integration for seamless alert flows

Every moment counts when you’re managing incidents that can affect your services and customers. That’s why we’re excited to introduce a new bi-directional integration between Grafana OnCall and ServiceNow, a popular platform many large organizations rely on to help manage their incidents.

Introduction to Ingesting logs with Loki | Zero to Hero: Loki | Grafana

Have you just discovered Grafana Loki? In this Zero to Hero episode, we dive deeper into how to ingest your logs into Loki. Buckle up and get ready to learn about: Grafana Cloud is the easiest way to get started with Grafana dashboards, metrics, logs, and traces. Our forever-free tier includes access to 10k metrics, 50GB logs, 50GB traces and more. We also have plans for every use case.

How to Monitor Steel Alloys with Grafana | 2024 Golden Grot Award Winner: Dr. Christopher Field

Meet Dr. Christopher Field, our 2024 Golden Grot award winner in the professional category. Dr. Field is the Co-founder and President of Theia Scientific, whose software helps researchers stream images from room-sized electron microscopes to a time series database and machine learning models that are used to instantly identify defects in alloy.

Serverless observability: How to monitor Google Cloud Run with OpenTelemetry and Grafana Cloud

OpenTelemetry has emerged as the go-to open source solution for collecting telemetry data, including traces, metrics, and logs. What’s especially unique about the project is its focus on breaking free from the reliance on proprietary code to offer users greater control and flexibility. As a senior solutions engineer here at Grafana Labs, I’ve spent a lot of time exploring OpenTelemetry, including in my spare time.

How to visualize Amazon CloudWatch metrics in Grafana

In the wide world of observability, you have many options for visualizing metrics collected by Amazon CloudWatch. And because of that, you’re often left making lots of decisions — about cost, configurations, flexibility, and more. At Grafana Labs, we stick to our “big tent” philosophy, which means we don’t force you into a decision or even tell you that you have to bring your CloudWatch metrics to Grafana Cloud.

Beginners Guide - All about Alert List visualization | Grafana

Do you want to know what an alert list visualization is and how you can create one in Grafana? Join Senior Developer Advocate Marie Cruz in this beginner-friendly tutorial to learn how alert list visualization works in Grafana. Grafana Cloud is the easiest way to get started with Grafana dashboards, metrics, logs, and traces. Our forever-free tier includes access to 10k metrics, 50GB logs, 50GB traces and more. We also have plans for every use case.

How to use Grafana Beyla in Grafana Alloy for eBPF-based auto-instrumentation

At GrafanaCON last month, we announced Grafana Alloy, our open source distribution of the OpenTelemetry Collector. Alloy is a telemetry collector that is 100% OTLP compatible and offers native pipelines for OpenTelemetry and Prometheus telemetry formats, supporting metrics, logs, traces, and profiles. Today, we are excited to share that Grafana Beyla is now available in Grafana Alloy as the default eBPF-based application auto-instrumentation solution.

Beginners Guide - All about Dashboard List visualization | Grafana

Do you want to know what a dashboard list visualization is and how you can create one in Grafana? Join Senior Developer Advocate Marie Cruz in this beginner-friendly tutorial to learn how dashboard list visualization works in Grafana. Grafana Cloud is the easiest way to get started with Grafana dashboards, metrics, logs, and traces.

Grafana OnCall: Connect to Discord, Mattermost, and more with webhooks

One important consideration when adopting a tool is whether it can integrate with your existing workflows and services. Each scenario can be highly specific, which is why it’s important to look for tools that have a public API or customizable webhooks. Last year, Grafana OnCall expanded its webhook support to allow for more complex setups, offering greater flexibility to interact with other services during alert group events.

Grafana 11 Features for Developers | Grafana

Grafana 11 is now GA! In this video, we do a deep dive exploring all of the new features for our developers. In this video, learn more about: Grafana Cloud is the easiest way to get started with Grafana dashboards, metrics, logs, and traces. Our forever-free tier includes access to 10k metrics, 50GB logs, 50GB traces and more. We also have plans for every use case.

Grafana Cloud updates: revamped Synthetic Monitoring, improvements to Kubernetes Monitoring, and more

We consistently release helpful updates and fun features in Grafana Cloud, our fully managed observability platform powered by the open source Grafana LGTM Stack (Loki for logs, Grafana for visualization, Tempo for traces, and Mimir for metrics). In case you missed it, here’s a roundup of the latest and greatest updates for Grafana Cloud this month. You can also read about all the features we add to Grafana Cloud in our What’s New in Grafana Cloud documentation.

AI-powered insights for continuous profiling: introducing Flame graph AI in Grafana Cloud

Like many in the observability space, we see a lot of potential in harnessing AI to enhance the developer experience. As we continue to evolve and expand our observability platform, we strive to develop features that not only solve complex problems, but make it easier to access and derive value from tools like Grafana Pyroscope.

Grafana 11 Now GA: Here's the TL;DR | Grafana

Grafana 11 is here! Our next major release is now GA. Think of it as your quick guide to all of the new goodies! Grafana Cloud is the easiest way to get started with Grafana dashboards, metrics, logs, and traces. Our forever-free tier includes access to 10k metrics, 50GB logs, 50GB traces and more. We also have plans for every use case.

How to explore metrics without PromQL queries in Grafana

At GrafanaCON 2024, Grafana founder Torkel Ödegaard introduced Grafana 11, which has a feature set that aligns with the same goals we’ve had since the OSS project launched in 2013. “The core mission of Grafana that we’ve had from the start is to make observability easy and powerful through good UX design, a focus on ease of use, and user flexibility and freedom,” Torkel said.

Grafana transformations: 10 new ways to get more out of your data

One of the superpowers of Grafana is the ability to bring all of your data into a single platform thanks to our rich catalog of data sources. Oftentimes you will want to visualize information from disparate data sources together in a single dashboard or panel. Or you might want to refine data returned from queries without altering the original data source. Or you may need to modify data due to limitations of a query language that stops you from getting the required formatting.

Grafana Alerting: new tools to resolve incidents faster and avoid alert fatigue

The maturity of your alerting strategy has a direct impact on the reliability of your infrastructure and your applications. It can also have a big impact on engineering productivity. So whether you’re talking about resolving incidents faster or avoiding alerting fatigue, alerting should always be front and center.

Explore, Beyla, Asserts, Loki 3.0, AI/ML: ObservabilityCON on the Road Keynote 2024 | Grafana

In this talk, RichiH (Office of the CTO) discusses the latest updates on our announcements from our flagship ObservabilityCON event in London 2023, including Explore Metrics, Explore Logs, Beyla, Asserts, Loki 3.0. Plus, learn how we're leveraging AI/ML to reduce a little bit of that toil in your observability practice. This talk includes a demo of Explore Logs and Asserts.

How to Prioritize Critical Resources with Grafana SLO-driven IRM | ObservabilityCON on the Road 2024

New to Service Level Objectives (SLOs) and Service Level Indicators (SLIs)? Or curious how Grafana makes it easy to prioritize critical resources with SLO-driven Incident Response Management? In this recording, Marc and Mimi walk through a demo of Grafana SLO. See for yourself how Grafana SLO keeps your engineers in one location to ease collaboration and workflow automation during an incident response.

How to Unify Your Application and Infrastructure Observability With Grafana and Beyla

In this video, learn how Grafana simplifies observability with our Application Observability solution, streamlining monitoring for distributed systems. See how we leverage OpenTelemetry and Prometheus to minimize mean time to resolution for complex application challenges. With a commitment to open-source protocols, you can empower your team to own their data and navigate system complexities with confidence. Delve into Grafana's architecture to unlock the full potential of observability in your systems.

Grafana Enterprise data source plugins: A brief guide to what they are and how to get started

One of the most powerful features of Grafana is the ability to unify and derive value from your data, regardless of where that data lives. This is because we’re fully committed to making Grafana an open, composable, and extensible observability platform for our more than 20 million users worldwide. But how exactly do we deliver on that promise of openness and extensibility? Grafana data source plugins play a big role.

Scaling Runtime Diagnosis System w/ Grafana Pyroscope | Roblox at ObservabilityCON on the Road 2024

In this video, Xiaofeng and Jialin from Roblox introduce their journey in building a robust runtime diagnostic system using Pyroscope. With over 70 million daily active users and 4.4 million creators contributing to the platform, ensuring reliability and efficiency is paramount. They discuss the challenges faced in debugging production issues and the manual, inefficient methods previously used. Through thorough investigation and collaboration with Grafana Labs, they developed an on-demand profiling workflow, enabling engineers to identify and address performance bottlenecks effectively.

How to Achieve Observability as Code with Grafana | LiveRamp at ObservabilityCON on the Road 2024

Leveraging Terraform alongside Grafana, Kubernetes, and Helm providers, the SRE team at LiveRamp has transformed every aspect of their operational toolkit. From agent installations and synthetic checks to Grafana k6 performance testing, notification policies, contact points, and alerts into modular, code-based components, the team is crafting a cutting-edge observability solution powered by Grafana Cloud. Learn how this seamless integration ensures a robust, scalable, and easily manageable infrastructure that is setting new benchmarks for system reliability and efficiency around the business.

Use Grafana Alloy to collect Azure metrics with less hassle

Are you using the Azure metrics exporter to ship telemetry data to Grafana Cloud? Are you overwhelmed with the amount of configuration and complexity necessary to avoid being rate limited? Well, did you know that with Grafana Alloy, our distribution of the OpenTelemetry Collector with built-in Prometheus pipelines and support for metrics, logs, traces, and profiles, you can now: Let’s look at how these two features can reduce the complexity of your Alloy configuration.

Logs with Firehose: Stream logs to the AWS Observability app cheaper and easier

AWS is an essential part of many organizations’ tech stacks today, which is why we continue to make it easier to observe your environment in Grafana Cloud. We recently launched AWS Observability, a fully managed application for visualizing and alerting on dozens of AWS offerings. And with our latest update, we’re making it cheaper and simpler to ingest and query your AWS logs.

How to Stream AWS Logs to Grafana Cloud via Amazon Data Firehose | Grafana

In this video, we show you the steps to configure your Grafana account so you can start streaming AWS logs to Grafana Cloud using Amazon Data Firehose. It takes just a few minutes to set up so you can see your logs in Grafana Explore. Save money and time by using this new approach!

Grafana Incident: new tools for faster, simpler incident response

At Grafana Labs, we’re committed to helping teams dramatically improve how they manage and respond to incidents. Through Grafana Incident Response & Management (IRM), we provide tools to empower teams, streamline processes, and enhance the effectiveness of incident management strategies—and we’re constantly looking for ways to make our solution even better.

Data source security in Grafana: Best practices and what to avoid

Recently, an incorrect security report was published, claiming that there’s a SQL injection attack in Grafana. As we have communicated to the security researcher, this report is wrong. Authenticated users in Grafana have the same permissions as the user configured for the underlying data source.

Understanding Dashboards in Grafana | Panels, Visualizations, Queries, and Transformations

Gain a fundamental understanding of what Dashboards are in Grafana and how they can be used to visualise your data to ensure your systems remain healthy and operational. We'll cover the must know concepts, including panels, visualizations, queries, and transformations, that will ensure you have all the tools you need to build awesome dashboards in Grafana. Chapters: ☁️ Grafana Cloud is the easiest way to get started with Grafana dashboards, metrics, logs, and traces. Our forever-free tier includes access to 10k metrics, 50GB logs, 50GB traces and more. We also have plans for every use case.

Setting up your Grafana k6 performance testing suite: JavaScript tools, shared libraries, and more

Editor’s note: This blog post is the second in a series of posts about organizing your performance testing suite with Grafana k6. If you haven’t already, be sure to check out the first post in the series, which explores how to implement reusable test patterns and other best practices within your testing suite.

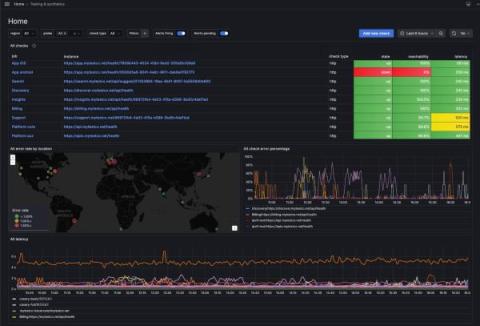
Grafana Cloud Synthetic Monitoring: How to simulate user journeys to ensure the best possible end-user experience

Here at Grafana Labs, we have a long-standing commitment to helping our users understand how their applications and services behave from an external point of view. This critical practice — known as synthetic monitoring — has been a key focus of ours for nearly a decade. Back in 2015, we released worldPing, our first product to help measure the user experience and improve website performance.

Proactively monitor user journeys with Grafana Cloud Synthetic Monitoring

Grafana Cloud Synthetic Monitoring proactively monitors the performance of your APIs and web applications from the user's perspective. Powered by Grafana k6, Synthetic Monitoring combines GUI-based and as-code monitoring to improve efficiency, collaboration, and application reliability. Watch this demo of how to use Synthetic Monitoring in Grafana Cloud.