Operations | Monitoring | ITSM | DevOps | Cloud

Latest Blogs

The Best Virtual Desktop Infrastructure Tools

The number of tools for IT Ops professionals to choose from is overwhelming. For this reason, we created the periodic table for IT Ops tools to better define, organize, and explain the IT Ops tooling landscape. It is our hope that it will help IT professionals find, explore, and choose tools for their future IT Ops stack.

8 Unbeatable Reasons to Choose NodeJS for Building Your Ecommerce Store

The increasing numbers of business are switching to e-commerce business to sell their products. As of now, there are more than 7,500,000 online stores operating around the world. Naturally, every online retailer is always in the lookout for the best possible ways to outlive their competition. E-commerce businesses cannot compromise on the performance, speed, usability, and scalability of their websites and this is why they need to choose the appropriate technologies diligently.

Apache Monitoring with Applicare

Because of its customizable modular architecture catering to a multitude of needs, Apache is a widely used cross-platform web server. Although it has highly stable nature, yet, performance bottlenecks in Apache web server lead to slowness in the web pages. Inability to see the number of web server requests and traffic spikes to the website makes server capacity management difficult.

Better Observability with New Container Agents

If you liked Sematext Docker Agent you’ll love our new agent for Docker monitoring that provides you with even more insight into your Docker, Kubernetes, and Swarm clusters. Because of its power, small footprint, and ease of installation the old Sematext Docker Agent enjoyed high adoption by the Docker DevOps community.

DevOps & SRE: Two Sides of the Same Coin?

Large organizations that wish to scale at an aggressive pace need IT departments that can be both nimble and agile. With DevOps and site reliability engineering (SRE) methodologies, IT teams can improve the agility, availability and performance of applications and services in their infrastructure. For those who are new to both concepts, here is a primer on how DevOps and SRE can work together to evolve IT operations.

Thanks, Gartner! We're in the 2019 Magic Quadrant for APM

It’s raining accolades for ManageEngine Applications Manager, and we’re psyched! After being named a January 2019 Gartner Peer Insights Customers’ Choice for Application Performance Monitoring Suites, Gartner has also recognized Applications Manager as a niche player in its 2019 Magic Quadrant for Application Performance Monitoring.

The Business Case for Container Adoption

Developers often believe that demonstrating the need for an IT-based solution should be very easy. They should be able to point to the business problem that needs a solution, briefly explain what technology should be selected, and the funds, staff, and computer resources will be provided by the organization. Unfortunately, this is seldom the actual process that is followed.

How to Monitor Amazon EC2 with CloudWatch

Amazon EC2 allows you to spin up servers for your application without having to actually manage physical hardware. However, since it’s a managed service, you have less visibility with traditional monitoring tools. As such, it becomes even more important to take advantage of the available monitoring tools in AWS. In this post, we’ll explain how to use CloudWatch to monitor EC2 and what is important to watch.

Grafana Plugin Tutorial: Polystat Panel (Part 1)

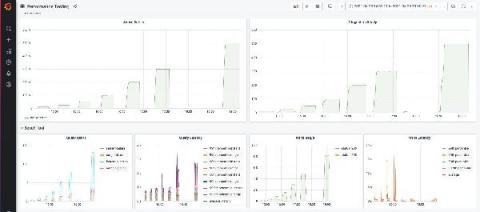
The grafana-polystat-panel plugin was created to provide a way to roll up multiple metrics and implement flexible drilldowns to other dashboards. This example will focus on creating a panel for Cassandra using real data from Prometheus collected from our Kubernetes clusters. We’ll focus on the basic metrics for CPU/Memory/Disk coming from cAdvisor, but a well-instrumented service will have many metrics that indicate overall health, such as requests per second, error rates, and more.