Operations | Monitoring | ITSM | DevOps | Cloud

Latest Posts

Our Favorite Grafana Dashboards

Grafana is an open-source visualization and analytics tool that lets you query, graph, and alert on your time series metrics no matter where they are stored - Grafana dashboards provide telling insight into your organization. All data from Grafana Dashboards can be queried and presented with different types of panels ranging from time-series graphs and single stats displays to histograms, heat maps, and many more.

Monitoring your infrastructure with StatsD and Graphite

Collecting metrics about your servers, applications, and traffic is a critical part of an application development project. There are many things that can go wrong in production systems, and collecting and organizing data can help you pinpoint bottlenecks and problems in your infrastructure. In this article, we will discuss Graphite and StatsD, and how they can help form the basis of monitoring infrastructure.

The Best Cloud Infrastructure Automation Tools

The past decade has seen a drastic growth in the adoption of public cloud. One of the primary reasons for this is its cheaper infrastructure and ease of scale. With such rapid adoption of public cloud, the need for infrastructure automation also arises. This is because teams want to quickly provision infrastructure and automate tasks that previously took weeks in the case of traditional data centers, down to minutes in the public cloud.

What are Prometheus Functions?

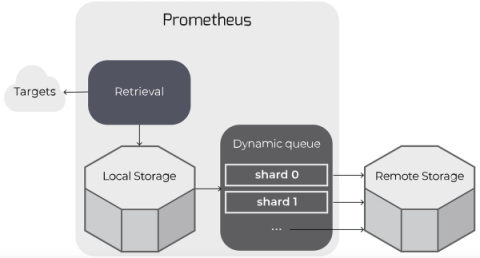
Prometheus is a platform for real-time systems and event monitoring and alerting. The Prometheus project is free, open-source, and available on GitHub. Originally developed at SoundCloud, Prometheus became a project of the Cloud Native Computing Foundation in 2016, alongside other popular frameworks such as Kubernetes. The core of the project is the Prometheus server, which acts as the system’s “brain” by collecting various metrics and storing them in a time-series database.

Configuring Python StatsD Client

Building and deploying highly scalable, distributed applications in the ever-changing landscape of software development is only half the journey. The other half is monitoring your application states and instances while recording accurate metrics. There are moments when you wish to check how many resources are being consumed, how many files are under access by the specialized process, etc. These metrics provide valuable insights into our tech stack execution and management.

Observability-OSS vs Paid vs Managed OSS with Hosted Graphite

Observability is a critical aspect of modern software development and infrastructure management. It involves the ability to gain insights into the internal workings of your systems, applications, and services through monitoring and collecting relevant data. With the increasing complexity of technology stacks and the need for real-time visibility, observability has become a fundamental requirement for businesses across various industries.

Monitoring Machine Learning

I used to think my job as a developer was done once I trained and deployed the machine learning model. Little did I know that deployment is only the first step! Making sure my tech baby is doing fine in the real world is equally important. Fortunately, this can be done with machine learning monitoring. In this article, we’ll discuss what can go wrong with our machine-learning model after deployment and how to keep it in check.

Heroku Monitoring: What To Look For In Your Addons

Heroku is a cloud-based platform that supports multiple programming languages. It functions as a Platform as a Service (PaaS), allowing developers to effortlessly create, deploy, and administer cloud-based applications. With its compatibility with languages like Java, Node.js, Scala, Clojure, Python, PHP, and Go, Heroku has become the preferred choice for developers who desire powerful and adaptable cloud capabilities.

What is Graphite Monitoring?

Today we are going to touch up on the topic of why Graphite monitoring is essential. In today’s current climate of extreme competition, service reliability is crucial to the success of a business. Any downtime or degraded user experience is simply not an option as dissatisfied customers will jump ship in an instant. Operations teams must be able to monitor their systems organically, paying particular attention to Service Level Indicators (SLIs) pertaining to the availability of the system.