Operations | Monitoring | ITSM | DevOps | Cloud

Latest Posts

Step-by-step Guide to Monitor Logstash With Telegraf and MetricFire

Monitoring your Logstash service is crucial for several reasons, especially given its pivotal role in log processing and data pipeline architectures. Logstash often operates as part of the Elastic Stack (formerly known as ELK Stack, for Elasticsearch, Logstash, and Kibana), ingesting data from various sources, transforming it, and then outputting it to a storage and visualization layer.

Easy guide to Monitor Elasticsearch Using Telegraf and MetricFire

Monitoring Elasticsearch is crucial for ensuring optimal performance and reliability of the search and analytics engine, as it helps identify issues related to query performance, resource utilization, and system health before they impact users. It also provides insights into the efficiency of data indexing and retrieval processes, enabling timely adjustments to configurations, scaling decisions, and optimization of search queries to maintain high availability and fast response times.

Step-by-step Guide to Monitor Riak Using Telegraf and MetricFire

Monitoring your databases is essential for maintaining performance, reliability, security, and compliance of your infrastructure. It allows you to stay ahead of potential issues, optimize resource utilization, and ensure a smooth and efficient operation of your database system. Effective monitoring of Riak involves collecting, analyzing, and acting on a variety of metrics and logs.

Easy guide to Monitoring Puppet with Telegraf and MetricFire

Monitoring your Puppet runs and automations is essential for maintaining performance, reliability, security, and compliance of your infrastructure. It allows you to stay ahead of potential issues, optimize resource utilization, and ensure a smooth and efficient operation of your database system.

Heroku Router Path Metrics

We are pleased to announce that we have released a new feature that allows you to collect Heroku Router metrics by path! By default, this option will not be enabled as it will increase your number of total metrics. If no action is taken, you will continue to receive your Router metrics in the default format. This provides a good overview of your application’s total connection times, requests by method/status, etc.

Monitor Heroku Add-Ons Using Hosted Graphite

Monitoring your Heroku stack helps you understand the performance of your application and infrastructure. You can identify bottlenecks, slow-performing queries, or resource-intensive processes and optimize them. Monitoring also allows you to detect issues or anomalies in real-time. By setting up alerts based on predefined thresholds, you can be notified as soon as something goes wrong, enabling you to address the issue before it affects users.

Step-by-step Guide for Monitoring Redis Using Telegraf and MetricFire

Monitoring Redis instances is essential for maintaining performance, reliability, and security. It allows you to detect issues early, optimize resources, and provide a seamless experience for both developers and end-users. Monitoring your database allows you to track key performance metrics such as memory usage, CPU usage, and query response times. By analyzing these metrics, you can identify performance bottlenecks, optimize queries, and ensure that Redis is operating efficiently.

Analyze Your Mailchimp Campaigns Using Telegraf

Monitoring your email campaigns helps you track key performance indicators (KPIs) such as open rates, click-through rates, and conversion rates. This evaluation provides insights into the success of your email campaigns and allows you to identify areas for improvement and by analyzing metrics like open rates and click-through rates, you can gauge the level of engagement your emails are generating.

How to Monitor Your RabbitMQ Performance Using Telegraf

Monitoring RabbitMQ is essential for maintaining the health, performance, and reliability of your messaging infrastructure. It empowers you to take proactive measures, prevent downtime, and deliver a seamless messaging experience for your applications and users. Monitoring helps you keep an eye on the performance metrics of RabbitMQ, such as message rates, queue lengths, and resource utilization.

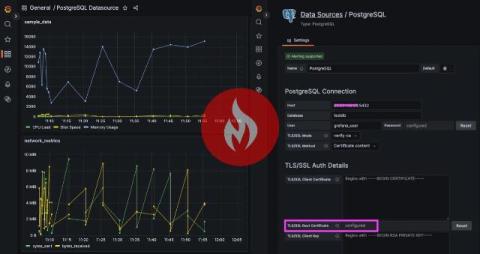
How to Monitor PostgreSQL With Telegraf and MetricFire

Monitoring your PostgreSQL instance is essential for maintaining performance, reliability, security, and compliance. It allows you to stay ahead of potential issues, optimize resource utilization, and ensure a smooth and efficient operation of your database system. Database monitoring helps you can pinpoint problematic queries, analyze execution plans, and make necessary adjustments to improve overall application responsiveness.