Operations | Monitoring | ITSM | DevOps | Cloud

Latest Posts

Grafana Tempo 2.4 release: TraceQL metrics, tiered caching, and TCO improvements

Grafana Tempo 2.4 is here and comes with a stack of new features and enhancements to help improve performance and operational capabilities. Check out the video above, which highlights the new experimental TraceQL metrics feature that creates metrics from traces, and continue reading to get a quick overview of all the latest updates in Tempo. If you’re looking for something more in-depth, don’t hesitate to jump into the Grafana Tempo 2.4 release notes or the changelog.

Grafana Cloud updates: AI for incident response, Enterprise plugins, Kubernetes alerting, and more

At Grafana Labs, we’re constantly shipping new features to help our users get the most out of Grafana Cloud. In case you missed it, here’s a roundup of all the Grafana Cloud news, updates, and improvements you should know about.

How to monitor a home VPN from anywhere with Grafana Cloud

I’m a senior solutions engineer here at Grafana Labs, but I recently found myself trying to solve a real-world problem in my homelab. The issue was, I have some services running there and I want to be able to access my home network when I’m away. Of course, I had to make sure my network remains safe when I do that, so I decided to deploy a simple and secure VPN.

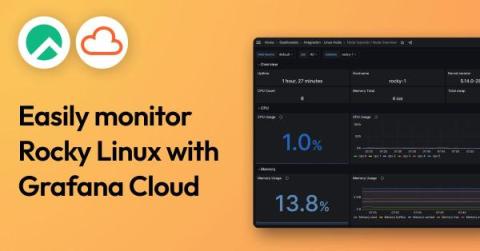
Easily monitor your Rocky Linux server using the Linux integration for Grafana Cloud

Rocky Linux is a community-driven, open source operating system that is backed by CIQ, the primary sponsor and support provider. This OS is a powerful alternative for those seeking a downstream, binary-compatible option to Red Hat Enterprise Linux (RHEL). CIQ supports Rocky Linux as a response to changes in the CentOS project, which is no longer maintained as a stable downstream clone of RHEL.

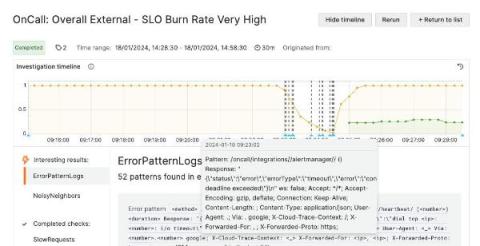
AI-powered diagnostics for incident response: New Sift features in Grafana IRM

Sift is a machine-learning-powered diagnostic feature in Grafana Cloud that SREs and DevOps teams can use to automate routine parts of incident investigation, such as searching for new errors in logs, surfacing recent deployments, or identifying overloaded Kubernetes nodes. We want Sift to springboard you into an investigation, so useful context is already there by the time you see an alert or declare an incident.

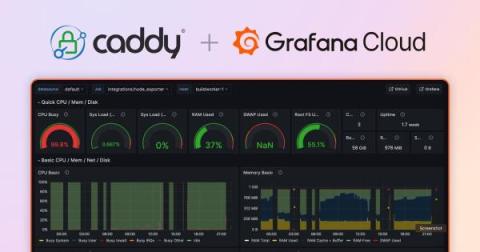
How the open source Caddy server uses Grafana Cloud for full-stack observability

Mohammed Al Sahaf serves as Technical Product Manager at Samsung Electronics Saudi Arabia. Outside his day job, he serves with the Caddy team to tackle the web of problems facing web servers in the third millennium. Mohammed is the author of Kadeessh, formerly caddy-ssh, and the maintainer of numerous Caddy modules. When he isn’t programming, he is trying to catch up on life and sleep with the help of coffee.

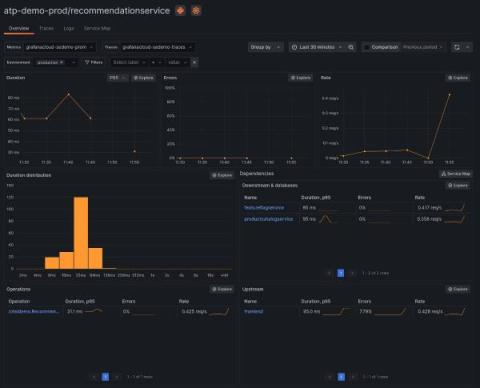
How to instrument your Python application using OpenTelemetry

If you want to see if OpenTelemetry helps you become a better Python developer — or if you just want to know how to add OpenTelemetry to your Python service — you’ve come to the right place. In this blog, we’ll show you how to instrument your Python application using OpenTelemetry and how to visualize your OpenTelemetry data using Application Observability in Grafana Cloud. We’ll walk you through the following steps.

OpenTelemetry: 3 questions to ask before choosing an observability solution

As OpenTelemetry rises in popularity, more organizations are implementing, or planning to implement, the open source project to monitor their applications — and, meanwhile, more vendors are offering OpenTelemetry support. In fact, a quick Google search for “OpenTelemetry support” shows results ranging from legacy APM vendors to newer, cloud native solutions like Grafana Cloud.

Kubernetes alerting: Simplify anomaly detection in Kubernetes clusters with Grafana Cloud

Despite the widespread adoption of Kubernetes, many DevOps teams and SREs still struggle to troubleshoot issues because of all the complexity that comes with the open source container orchestration platform. That’s why we developed Kubernetes Monitoring, an application in Grafana Cloud you can use to visualize and alert on your Kubernetes clusters.

'The Story of Grafana' documentary: From one developer's dream to 20 million users worldwide

On Dec. 5, 2013, Torkel Ödegaard made the first commit in GitHub for a personal project that would become Grafana. “It’s hard to believe it’s been 10 years since Torkel launched Grafana, growing from a small man with a big dream to becoming the most popular data visualization software in the world,” says Grafana Labs co-founder and CEO Raj Dutt. “The Story of Grafana” chronicles that meteoric journey.