Operations | Monitoring | ITSM | DevOps | Cloud

Latest Posts

Taking care of your loved ones with Grafana and other open source solutions

Amon Reich is the founder of SmartLiving.Rocks based out of Schweinfurt, Germany, an IoT solutions provider for smart homes and small businesses. Amon maintains the open source SeniorenSmarthome project, which enables Ambient Assisted Living through Grafana dashboards and other open source technologies. I’ve been working in the field of smart technology for over 10 years.

We think Grafana Labs has built something special - and two prestigious lists agree

We have always thought of our organization as special. Our plans were never to build a traditional business, and we know we have a unique culture. But it is nice when others outside of our company recognize that Grafana Labs is something special, too. This week, we were excited to be included on two very prestigious lists: The Enterprise Tech 30 and America’s Best Startup Employers.

Best practices for alerting on Synthetic Monitoring metrics in Grafana Cloud

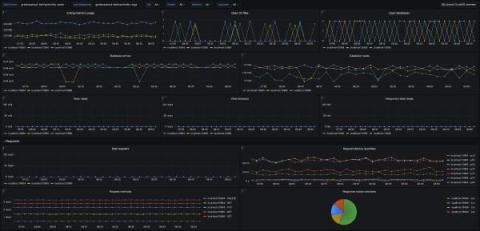
Ever wonder what your application looks like from the “outside in”? Synthetic monitoring can give you a global overview of your application from your customer’s point of view, observing how systems and applications are performing by simulating the user experience. One tool to help achieve this is the Synthetic Monitoring app, which is a blackbox monitoring solution available in Grafana Cloud. You can use Synthetic Monitoring to monitor your services from all over the world.

How to monitor your Apache Spark cluster with Grafana Cloud

Here at Grafana Labs, when we’re building integrations for Grafana Cloud, we’re often thinking about how to help users get started on their observability journey. We like to focus some of our attention on the different technologies you might come across along the way. That way, we can share our tips on the best ways to interact with them while you’re using Grafana Labs products.

Monitor real-time distributed messaging platform NSQ with the new integration for Grafana Cloud

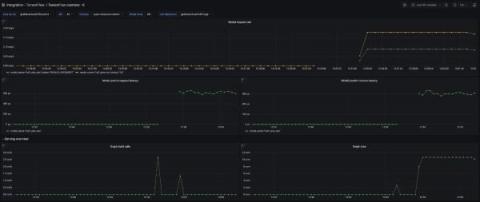
Today, I am excited to introduce the NSQ integration available for Grafana Cloud, our platform that brings together all your metrics, logs, and traces with Grafana for full-stack observability. NSQ is a real-time distributed messaging platform designed to operate at scale, handling billions of messages per day. It’s a simple and lightweight alternative to other message queues such as Kafka, RabbitMQ, or ActiveMQ. This will walk you through how to get the most out of the integration.

How Dapper Labs uses Grafana Cloud to meet the global demand of NFT Mania

Ever since a JPEG created by the digital artist Beeple sold for more than $69 million in 2021, the worldwide obsession with NFTs (non-fungible tokens) that represent digital collectibles, art, and media has been growing. A company at the forefront of the NFT world is the blockchain gaming studio Dapper Labs, which leverages blockchain to build addictive games (such as CryptoKitties), verify authentic digital collectibles, and run fan tokens for sports personalities and music artists.

New in Grafana 8.4: How to use full-range log volume histograms with Grafana Loki

In the freshly released Grafana 8.4, we’ve enabled the full-range log volume histogram for the Grafana Loki data source by default. Previously, the histogram would only show the values over whatever time range the first 1,000 returned lines fell within. Now those using Explore to query Grafana Loki will see a histogram that reflects the distribution of log lines over their selected time range.

How summary metrics work in Prometheus

A summary is a metric type in Prometheus that can be used to monitor latencies (or other distributions like request sizes). For example, when you monitor a REST endpoint you can use a summary and configure it to provide the 95th percentile of the latency. If that percentile is 120ms that means that 95% of the calls were faster than 120ms, and 5% were slower. Summary metrics are implemented in the Prometheus client libraries, like client_golang or client_java.

How to manage cardinality with out-of-the-box dashboards in Grafana Cloud

When there’s a cardinality explosion, it can cause problems: It’s a surprise, it’s noise, and it can increase your costs or cause performance degradation of your systems. Over the past year, we’ve improved our time series storage systems so that under normal use, high cardinality is no longer an issue. But as the operator of an observability platform, you should have tools you need to help protect that infrastructure.