Operations | Monitoring | ITSM | DevOps | Cloud

Latest Posts

Cortex v1.0 released: The highly scalable, fast Prometheus implementation is generally available for production use

We’re happy to announce that Cortex v1.0 has been released! The horizontally scalable, durable, and fast Prometheus implementation is now generally available for production use. At Grafana Labs, we’ve been using Cortex in production for almost three years, including to power the Prometheus backend for the Grafana Cloud managed logging and metrics platform.

Loki v1.4.0 released, with query statistics and up to 300x regex optimization

It has been a little over 2 months since 1.3.0 was released. We started prepping for the 1.4.0 release several weeks ago; however, when I was writing this very blog post for the release, we discovered some confusing stats from the new statistics objects (which we’ll talk about in a bit). After sorting that out, we played the usual game of, “Wait, don’t release yet!

How to successfully correlate metrics, logs, and traces in Grafana

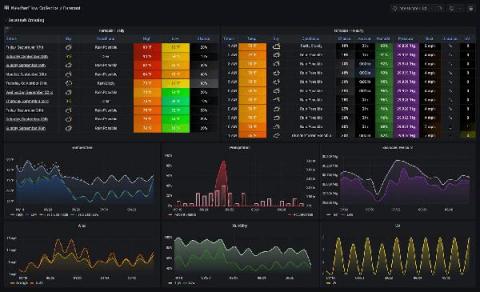
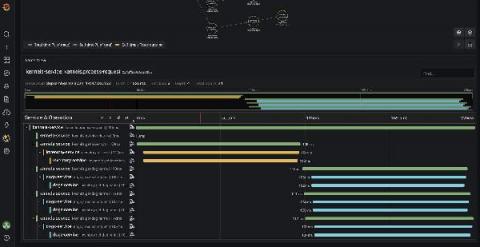
As everyone knows, the Grafana project began with a goal to make the dashboarding experience better for everyone, and to make it easy to create beautiful and useful dashboards like this one. But as Andrej Ocenas, a full stack developer at Grafana Labs, said in a recent FOSDEM 2020 presentation, the company has bigger ambitions for Grafana than just being a beautiful dashboarding application. What Grafana Labs is really aiming to do now is make Grafana into a full observability platform.

WFH tips: a technical guide to video conference calls

The COVID-19 pandemic has forced many companies to require employees to work from home. It’s a new normal for many, but at Grafana Labs our team has always recruited and operated with a remote-first culture in mind. To help everyone transition to a home office environment, we launched a new WFH series in which Grafana team members share their best advice for staying productive at home – yes, even if you have kids around.

How we're using gossip to improve Cortex and Loki availability

Have you heard about using the hash ring in Loki and Cortex? Here is a short version: In Cortex and Loki, the ring is a space divided by tokens into smaller segments. Each segment belongs to a single “ingester” (component in Cortex and Loki that receives data) and is used to shard series/logs across multiple ingesters. In addition to the tokens, each ingester also has an entry with its ID, address, and the latest heartbeat timestamp updated periodically.

Introducing Grafana Cloud Agent, a remote_write-focused Prometheus agent that can save 40% on memory usage

Today, we are announcing the Grafana Cloud Agent, a subset of Prometheus built for hosted metrics that runs lean on memory and uses much of the same battle-tested code that has made Prometheus so awesome. At Grafana Labs, we love Prometheus. We deploy it for our internal monitoring, use it alongside Alertmanager, and have it configured to send its data to Cortex via remote_write. Unfortunately, as we scale to handle more load, our deployment becomes more and more difficult to manage.

How to work from home with kids: More tips from the remote-first Grafana Labs team

With every tech company on Earth suddenly pretending they’re remote-friendly overnight, there are a lot of posts about how to work well from home. As a matter of fact, we wrote our own, so why would we write another? The answer is: kids.

How the Jsonnet-based project Tanka improves Kubernetes usage

At FOSDEM 2020, Grafana Labs software engineers Tom Braack and Malcolm Holmes explained how and why the team developed Tanka, a scalable Jsonnet-based tool for deploying and managing Kubernetes infrastructure. They also shared how Grafana Labs leverages the project to manage and monitor its own infrastructure as well as showcased how Tanka makes deploying a Grafana instance faster and more efficient.