Operations | Monitoring | ITSM | DevOps | Cloud

Latest Posts

Kubernetes CPU Requests & Limits VS Autoscaling

In a prior blog post, we discussed the basics of Kubernetes Limits and Requests: they serve an important role to manage resources in cloud environments. In another article in the series, we discussed the Out of Memory kills and CPU throttling that can affect your cluster. But, all in all, Limits and Requests are not silver bullets for CPU management and there are cases where other alternatives might be a better option.

AWS recognizes Sysdig as an Amazon Linux 2023 Service Ready Partner

Sysdig is pleased to announce that we’re now recognized as Amazon Linux 2023 Ready as part of the Amazon Web Services (AWS) Service Ready Program. Amazon Linux 2023 (AL2023) is the newest Linux operating system from AWS available to support your workloads running on Amazon EC2. The team at Sysdig validated AL2023 with Sysdig Secure and Sysdig Monitor to ensure full support for our container security and cloud-native monitoring capabilities with this latest OS.

Easily Monitor Google Cloud with Sysdig's Managed Prometheus

Google Cloud provides its own set of metrics for monitoring applications, services, and instances. There are a huge number of metrics – more than 1,500 different ones just for GCP monitoring! While this is great, dealing with such a number can also be overwhelming. Filtering, pulling, exploring, and storing the metrics that you really need can be an enormously time-consuming task, and a big challenge.

Bypassing Network Detection with Graftcp

What is the difference with similar tools? Detect graftcp with Falco Conclusion A new network open source tool called graftcp (GitHub page) has been discovered in everyday attacks by the Sysdig Threat Research Team (TRT). Nowadays, threat actors try to improve their techniques by using new tools (as we mentioned in the PRoot article) to enhance the compatibility of their code to hit as many targets as possible and hide their traces properly.

Monitoring with Custom Metrics

By kickstarting a monitoring project with Prometheus, you might realize that you get an initial set of out-of-the-box metrics with just Node Exporter and Kube State Metrics. But, this will only get you so far since you will just be performing black box monitoring. How can you go to the next level and observe what’s beyond? They are an essential part of the day-to-day monitoring of cloud-native systems, as they provide an additional dimension to the business and app level.

Prometheus and Kubernetes Metrics Ingestion

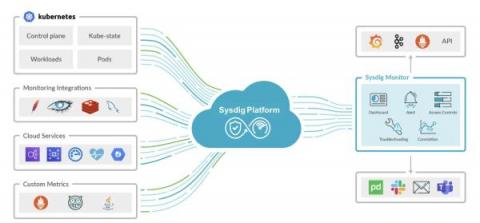
Prometheus is one the the most acclaimed solutions for Kubernetes monitoring. There are multiple add-ons and exporters that facilitate the task of pulling Kubernetes metrics. Sysdig Monitor is a cloud-native observability platform that helps businesses with the whole observability lifecycle. It provides simplicity at all times, allowing companies to rapidly pull their Kubernetes and Prometheus metrics without headaches.

What's New in Sysdig - February 2023

What’s New in Sysdig is back again with the February 2023 edition! I am Michael Rudloff, an Enterprise Sales Engineer based in the United Kingdom, and I am very excited to update you with the latest feature releases from Sysdig. This month, Sysdig Secure brings a couple of new features. We have added reports to Risk Spotlight – Risk Spotlight can show you which packages with vulnerabilities are currently in use in a running container across your whole Kubernetes environment.