Operations | Monitoring | ITSM | DevOps | Cloud

Latest Posts

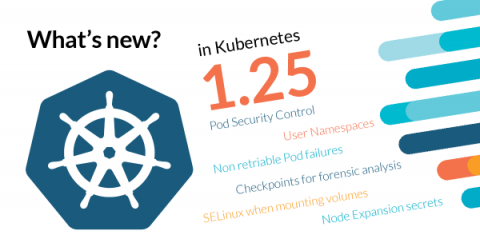
Kubernetes 1.25 - What's new?

Kubernetes 1.25 is about to be released, and it comes packed with novelties! Where do we begin? This release brings 40 enhancements, on par with the 46 in Kubernetes 1.24 and 45 in Kubernetes 1.23. Of those 46 enhancements, 13 are graduating to Stable, 10 are existing features that keep improving, 15 are completely new, and two are deprecated features.

What's new in Sysdig - July 2022

It’s time for another publication of What’s New in Sysdig in 2022! I’m in charge of the “What’s new in Sysdig” blog for the month of July! Hello, I’m Tom Linkin, a Sr. Solutions Engineer based in the Poconos up in Pennsylvania. I joined the incredible group of people at Sysdig nine months ago and have been helping support sales in the greater NYC region ever since.

How to Monitor PHP-FPM with Prometheus

PHP is one of the most popular open source programming languages on the internet, used for web development platforms such as Magento, WordPress, or Drupal. In addition to all PHP bases, PHP-FPM is the most popular alternative implementation of PHP FastCGI. It has additional features which are really useful for high-traffic websites. In this article, you’ll learn how to monitor PHP-FPM with Prometheus.

Collect critical AWS metrics faster with Sysdig

Today, we are excited to announce support for Amazon CloudWatch Metric Streams. This support will enable our customers to ingest metrics from AWS CloudWatch in real time, increase metric and state fidelity and time to ingestion while decreasing MTTR, and support cloud metrics at scale without the need to customize or re-configure new AWS service metrics. In this blog, we dig deep into.

How to monitor nginx in Kubernetes with Prometheus

nginx is an open source web server often used as a reverse proxy, load balancer, and web cache. Designed for high loads of concurrent connections, it’s fast, versatile, reliable, and most importantly, very light on resources. In this article, you’ll learn how to monitor nginx in Kubernetes with Prometheus, and also how to troubleshoot different issues related to latency, saturation, etc.

How to monitor and troubleshoot Fluentd with Prometheus

Fluentd is an open source data collector widely used for log aggregation in Kubernetes. Monitoring and troubleshooting Fluentd with Prometheus is really important to identify potential issues affecting your logging and monitoring systems. In this article, you’ll learn how to start monitoring Fluentd with Prometheus, following Fluentd docs monitoring recommendations. You’ll also discover the most common Fluentd issues and how to troubleshoot them.

KubeCon EU 2022 - Trends & Highlights

Kubecon EU returned to Spain. This time to Valencia, city of paella and horchata and, of course, a great place for big events. We had a great time meeting you all in person, and attending the talks. Here are our hot takes from the event. The main event started on Wednesday, but before that different co-located events took place: Ebpf Day, Cloud Native SecurityCon, and PrometheusDay among others. These events gathered a large number of attendees.