Operations | Monitoring | ITSM | DevOps | Cloud

Latest Posts

JMX monitoring + Java custom metrics.

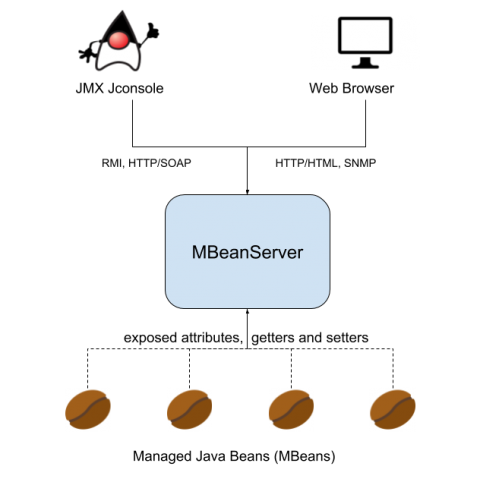
In this tutorial we are going to learn how to instrument Java code to expose application metrics using JMX monitoring. Following the code examples, you can monitor the availability, health and performance of your Java application. Java 1.5 introduced JMX – Java Management eXtensions – which is a standard way to instrument code in the JRE world.

NIST SP 800-190 application container security with Sysdig Secure

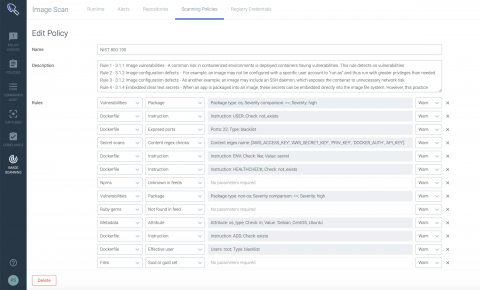
In September 2017, the National Institute of Standards and Technology (NIST) released Special Publication (SP) 800-190, Application Container Security Guide. NIST SP 800-190 explains the security concerns associated with container technologies and recommendations for the image details and container runtime security. It provides prescriptive details for various sections including image, registry, orchestrator, container and host OS countermeasures.

Announcing the Sysdig Cloud-Native Visibility + Security Platform 2.0

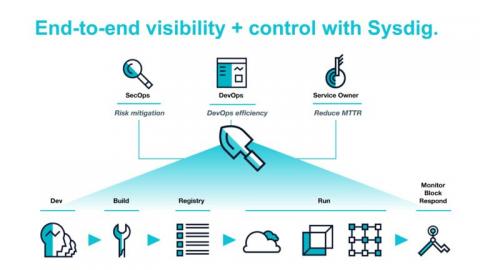
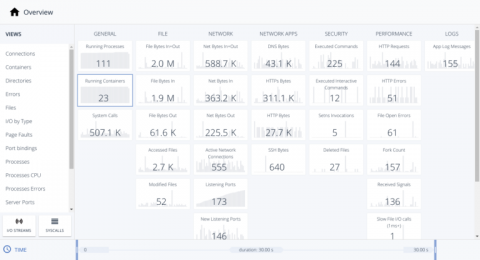
Today we’re announcing version 2.0 of the Sysdig Cloud-Native Visibility + Security platform. It provides a more powerful and significantly simpler way for enterprises to see the health, risk, and performance of their cloud-native environments in a single unified view.

Troubleshooting in Kubernetes: kubectl capture plugin

We are really happy to announce that we have released a plugin which allows to take captures using Sysdig in your Kubernetes cluster with just one simple command. And the answer for the next question you are asking yourself, is no. You don’t need to have Sysdig preinstalled in your cluster for this to work! This is our contribution to help you with your Kubernetes troubleshooting efforts.

Providing Visibility and Security for AWS App Mesh

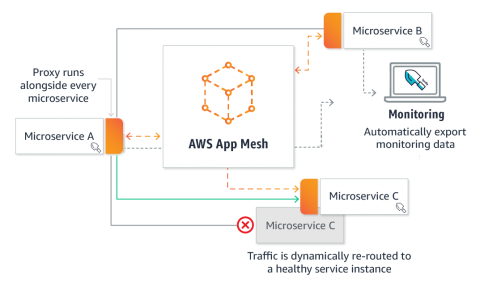
Microservice architectures running on containers have made applications easier to scale and faster to develop. As a result, enterprises are able to innovate faster and accelerate time-to-market for new features. To make management of microservices even more efficient and easier to run, service mesh solutions like Istio, Envoy, and Linkerd – and now AWS App Mesh – have become the next core building blocks of microservices infrastructure built on containers.

Monitoring StatsD: metric types, format & code examples

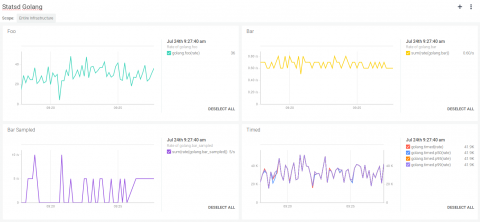
The StatsD stack is one of the most popular monitoring solutions to instrument your code using custom metrics. In this post we will describe the StatsD metrics architecture, metrics types and formats, proving code examples for the Golang, NodeJS/Javascript and Python programming languages.

Detecting and preventing cgroups escape via SCTP - CVE-2019-3874

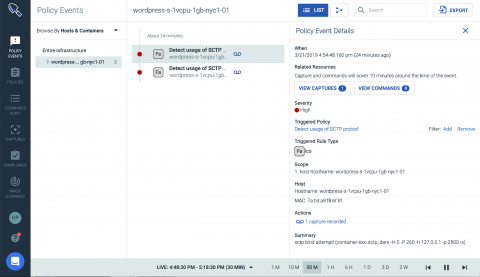
This week CVE-2019-3874 was discovered which details a flaw in the Linux kernel where an attacker can circumvent cgroup memory isolation using the SCTP socket buffer. In containerised environments, this has the potential for a container running as root to create a DoS.

Prometheus metrics / OpenMetrics code instrumentation

In the following example-driven tutorial we will learn how to use Prometheus metrics / OpenMetrics to instrument your code whether you are using Golang, Java, Python or Javascript. We will cover the different metric types and provide readily executable code snippets. Prometheus is an open source time series database for monitoring that was originally developed at SoundCloud before being released as an open source project.

Detecting the Kubernetes API Server DoS Vulnerability (CVE-2019-1002100)

Recently, a new Kubernetes related vulnerability was announced that affected the kube-apiserver. This was a denial of service vulnerability where authorized users with write permissions could overload the API server as it is handling requests. The issue is categorized as a medium severity (CVSS score of 6.5) and can be resolved by upgrading the kube-apiserver to v1.11.8, v1.12.6, or v1.13.4.