Operations | Monitoring | ITSM | DevOps | Cloud

Latest Posts

Falco 0.13.0 Released: Kubernetes Audit Events Support

We recently released Falco 0.13.0, which is probably the most exciting release since Falco’s 0.1.0 release almost two and a half years ago. With 0.13.0, we’re adding support for a second stream of events — Kubernetes Audit Events. This release also lays the groundwork for additional event sources to be easily added.

Monitoring and securing Kubernetes-based healthcare services on Google Cloud: Cota Healthcare

As Cota Healthcare moved to Kubernetes on Google Cloud, it chose Sysdig for Kubernetes monitoring and container security. With Sysdig, Cota accelerates healthcare service development, improves capacity planning, fixes issues rapidly, and strengthens its security posture.

A Java troubleshooting guide: network, memory leaks and threads

While the term ‘Java troubleshooting’ can apply to many, many scenarios, this post focuses on three particular long-standing Java production scenarios: a denial of service to a Java service endpoint, a memory leak, and troubleshooting a thread deadlock or race condition. Follow along as we use Java inside Docker containers to facilitate quick testing and show you how to use open source sysdig to quickly diagnose each troubleshooting scenario.

Detecting jQuery File Upload vulnerability using Falco (CVE-2018-9206)

In the past few days, a new vulnerability was disclosed in a widely used component – jQuery File Upload plugin. A change in Apache’s Web Server security setting handling, exposed users of this plugin to an unrestricted file upload flaw. Let’s dig in on how to detect jQuery File Upload vulnerability (CVE-2018-9206) using Falco.

Monitoring Java using JMX and custom metrics

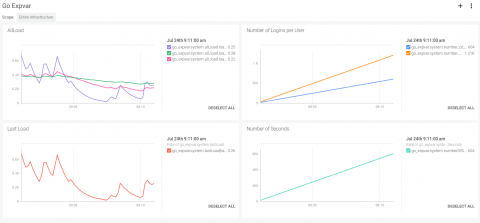
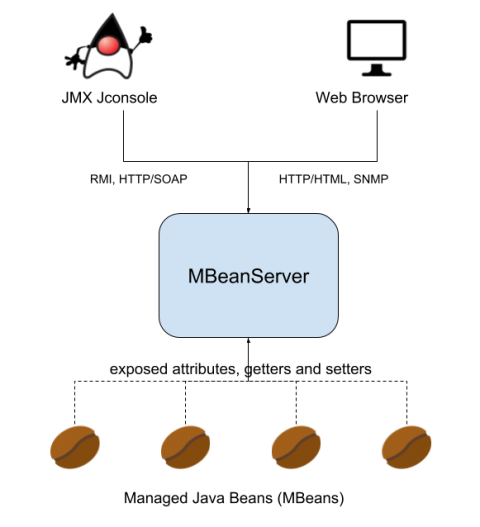
JMX (Java Management Extensions) is a set of specifications conceived to monitor and manage Java applications. To implement the JMX technology, you need to create and register MBeans (Managed Beans) as part of your Java code. Using JMX technology and tools, Java application developers can get the dynamic state of the application and use it for performance tuning, troubleshooting and debugging.

Monitoring Java applications: Memory usage, threads and other JRE metrics

In this post we will cover how to monitor the Java Runtime Environment (JRE). You will learn how to assess the performance of your Java application by profiling its memory usage, the garbage collector metrics, monitoring Java daemon and user threads and other fundamental JRE metrics. We will finish with a real Java JRE troubleshooting example using opensource Sysdig and Docker.

Sysdig Monitor 3.0 - Enterprise-grade Prometheus, Kubernetes insights and more.

Today we announced the launch of enterprise-grade Prometheus monitoring with Sysdig Monitor 3.0. We’ve added new Prometheus capabilities like PromQL, a Grafana plugin and new enhancements for our already rich Kubernetes monitoring. If you love Prometheus like we do, and especially if your cloud environment is growing quickly, read on to learn more about what we’re doing with Prometheus, Kubernetes and more.