Operations | Monitoring | ITSM | DevOps | Cloud

Latest News

What's With All the New Observability Tools?

Organizations struggle with getting the right visibility into their environments. Better visibility can improve performance, increase uptime (or decrease downtime, depending on your perspective) and ultimately improve customer satisfaction. Finding the right tool, however, can be a real challenge. Making matters even worse, vendors seem to be announcing new observability platforms every day.

Top 8 VScode Python Extensions

Visual Studio Code (VScode) is an open-source and cross-platform source-code editor. It was ranked the most popular development tool in the Stack Overflow 2021 Developer Survey, with 70% of the respondents using it as their primary editor. VScode allows you to use a few programming languages like JavaScript and TypeScript. Still, you need an extension if you want to use any other programming language and include extra functionalities to improve your code.

Ingesting HTTP Access Logs from AppService

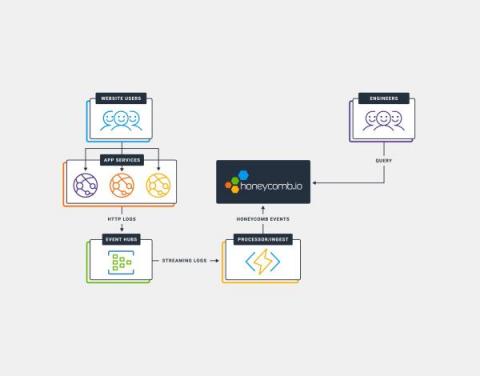
Debugging application performance in Azure AppService is something that’s quite difficult using Azure’s built-in services (like Application Insights). Among some of the issues are visualizations, and the time it takes to be able to query data. In this post, we’ll walk through the steps to ingest HTTP Access Logs from Azure AppService into Honeycomb to provide for near real-time analysis Access Logs.

Getting Started with OpenTelemetry for Observability

This article was published in The New Stack. For most developers, software development means there is an API for almost everything, hardware is provisioned via the cloud and the core focus is on building only the features most crucial to your business. Of course, all these integrations and modern distributed architectures create their own set of problems. Having full insight into your application has become even more important and is now commonly known as observability.

State of Observability 2022: Modernization Cannot Succeed without Observability

As organizations look to become cloud-first to meet the growing demands of the shifts in the ways we do business, we have seen the pace of digital transformation accelerate. As a result, organizations have evolved their cloud strategies to multi-cloud environments and are adopting more containers, microservices, and cloud native technologies. This is creating increasingly distributed systems, making it harder to gain a comprehensive view into how they’re performing.

Debugging Gson, Moshi and Jackson JSON Frameworks in Production

Parsing bugs are the gift that keeps giving in the age of APIs. We use a service; it works perfectly in debugging, QA, etc. Then some user input that made its way to the web request, returns a result we just can’t parse. Unfortunately, there isn’t much we can do at this stage. We need to understand why the failure occurred and how we can workaround it and fix it.

Short and Exciting Journey of M1 Build Agent Configuration

Back in November 2020 Apple’s M1 chip was introduced and as the end users moved forward to M1 based Macs it became mandatory to build applications that are compatible with the new technology. The M1 chip has incredible improvements and features but I won’t cover them in this post.There are many resources on the internet covering this and I encourage you to explore them. In this post I will cover several challenges I tackled while setting up an M1 build.

OpenTracing vs. OpenTelemetry

Monitoring and observability have increased with software applications moving from monolithic to distributed microservice architectures. While observability and application monitoring share similar definitions, they also have some differences. The purpose of both monitoring and observability is to find issues in an application. However, monitoring aims to capture already known issues and display them on a dashboard to understand their root cause and the time they occurred.

Authors' Cut-Structured Events Are the Basis of Observability

At its core, observability is understanding the internal state of your systems based on the telemetry they output so you can effectively troubleshoot, debug, and tune performance. However, there’s a tendency to reduce observability to a collection of logs, metrics, and traces, which strips away much of the visibility you need to understand what’s going on.