Operations | Monitoring | ITSM | DevOps | Cloud

Latest Videos

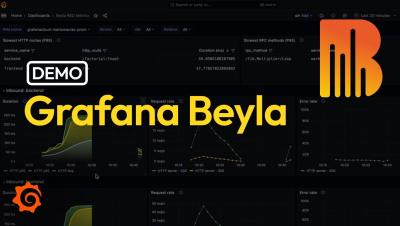
Zero-code application observability with Grafana Beyla and eBPF: demo

The eBPF-based OSS auto-instrumentation tool Grafana Beyla makes it easier to get started with application observability. Beyla provides RED (Rate, Errors, Duration) metrics through OpenTelemetry or Prometheus for your existing web services, whichever language they are written in. You don’t need to change any line of application code or configuration; you only need to deploy the Beyla in the same host as the service that you want to monitor. Collecting monitoring data with the eBPF autoinstrument tool has very low overhead, and allows you to capture data about your runtime, which is impossible with manual code instrumentation. Watch this in-depth demo of how to use Grafana Beyla to get started with application observability.

Control Prometheus cardinality and metrics cost with Adaptive Metrics

Adaptive Metrics is a cost management feature in Grafana Cloud that helps enterprises control Prometheus cardinality and reduce their observability spend by identifying and eliminating unused metrics. Grafana Cloud customers using Adaptive Metrics see 20-50% reduction in their observability bill.

Combining frontend and backend performance with John Hill (Grafana Office Hours #18)

In this episode of Grafana Office Hours, Developer Advocates Marie Cruz and Nicole van der Hoeven speak with John Hill, a Web UI Test Engineer and Grafana k6 champion, to talk about how the Grafana and k6 ecosystems can be used to ensure performance in mission-critical applications like NASA’s Open MCT.

What is Observability? Grafana for Beginners Ep. 1

When you are getting started with observability, the jargon and concepts used to explain observability may go straight over your head. Let’s take out the complexity and talk about observability in the simplest terms possible. Join Lisa Jung, a senior developer advocate at Grafana, to get your learning on with the Grafana for Beginners series. You will learn about concepts such as observability and DevOps and how Grafana can be used to observe your system as a part of your DevOps practice.

Real user monitoring with Grafana (Grafana Office Hours #17)

Have you heard of Grafana Faro and how it can help in providing insights into your real user experience? Developer Advocates Nicole van der Hoeven and Marie Cruz chat with Software Engineers Kostas Pelelis and Marco Schaefer to discuss what Grafana Faro is, why it's important to have a real user monitoring solution, and how to get started with Grafana Faro.

Grafana panel title generator, interactive visualizations, and more

Dive deep into the enhancements in Grafana 10.2. From embedding interactive buttons within Canvas visualizations to utilizing AI for dashboard titles and descriptions, this release brims with features designed to optimize your Grafana experience. In this video, discover how to: Stay with us through this playlist to delve deeper into each addition and maximize your Grafana 10.2 experience.

How to navigate alerting insights in Grafana Cloud

Navigate your alerting systems in Grafana Cloud with the new Alerting Insights feature. This enhanced landing page provides a comprehensive view of your alerting data, from Grafana managed rules to Mimir managed rules, and highlights critical trends in your organization's alert management performance.

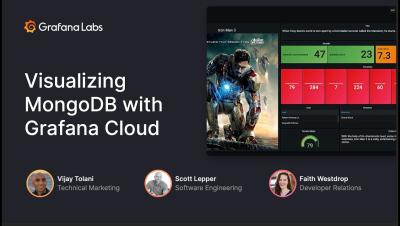
Visualizing MongoDB with Grafana Cloud

Learn to connect your MongoDB data and other data sources to a single dashboard to provide impactful insights into your business and improve visibility across teams. Vijay Tolani will demonstrate how to translate and transform your existing application and business metrics into flexible and versatile charts within dashboards using a wide array of visualizations, such as panels, bar gauges, geomaps, and more. Also query and alert on MongoDB and MongoDB Atlas data in real time without having to migrate or ingest it.