Operations | Monitoring | ITSM | DevOps | Cloud

The Place Where Modern Operations & Technology Come Together


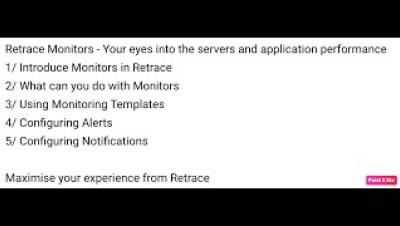
Highly effective Monitors, Alerts and Notifications - In Stackify Retrace
Retrace Monitors - Your eyes into the servers and application performance 1/ Introduce Monitors in Retrace 2/ What can you do with Monitors 3/ Using Monitoring Templates 4/ Configuring Alerts 5/ Configuring Notifications Maximise your experience from Retrace.

Sustainable Futures: Revolutionizing Data Centers and Tech Practices - Navigate Europe 23
Join us at Navigate Europe 23 for a critical conversation on sustainability in the tech industry, focusing on the challenges and innovative solutions related to data centers. Our expert panelists Amanda Brock, Dinesh Majrekar, John Ridd, Mark Bjornsgaard & Mike Paisley share their insights and experiences, discuss the role of governance and regulation, and emphasize the power of individual and collective action in driving change. Whether you're in the tech industry or simply interested in sustainability, this discussion is not to be missed!
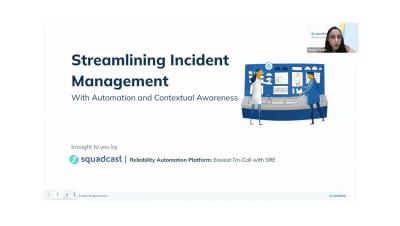
Webinar: Streamlining Incident Management With Automation and Contextual Awareness
In the modern context of distributed teams & complex digital infrastructure, major incidents having a negative impact spanning multiple teams and services can cause a barrage of alerts. While a meticulously designed incident response strategy can aid in restoring order, it's essential to underscore the significance of providing responders with effective tools that offer contextual understanding and facilitate the identification of actionable alerts.

A Brief History of BGP Incidents
Kentik internet analysis expert, Doug Madory, discusses the most notable and significant BGP incidents in the history of the internet, from traffic-disrupting leaks to recent crypto-stealing hijacks. Stretching back to the AS7007 leak of 1997, this webinar uses a historical perspective to explore the questions: what progress has been made and what is the path to finally securing BGP?

Fighting DDoS at the Source
For decades, the scourge of distributed denial of service (DDoS) attacks has plagued the internet. Join Doug Madory, Director of Internet Analysis at Kentik, and Aaron Weintraub, Principal Engineer at Cogent Communications, as they explain how organizations can identify customer networks sending the spoofed traffic that leads to DDoS attacks.

The State of Sustainability | The Future of Open Source
Two years ago, we co-hosted our first Future of Open Source event together with GitHub Sponsors. Six maintainers helped us consider the question, “Is it sustainable?” Much has happened since then, and it’s time to check in again on the state of sustainability in Open Source.