Operations | Monitoring | ITSM | DevOps | Cloud
%term
PPS Spike Every 110 Seconds on AWS EC2
I don’t know what to say about this post… I found something weird while investigating PPS on EC2. It seems to correlate with CPU credits on t1/t2/t3 instances, but is consistently inconsistent in presentation. It only shows up when you track the stats yourself, because Cloudwatch doesn’t show the 1-second granularity needed to see these numbers.
October Launch Notes: New Raygun4Apple provider, updated agent, and new default login page
Raygun’s Launch Notes are your regular roundup of all the improvements we made to Raygun in the last month — from major feature releases to performance updates.
Win-Win Deployment Strategies for Modern Apps
These days, the biggest change to software development is the frequency of deployments. Product teams deploy releases to production earlier (and more often). Months or years-long release cycles are becoming rare—especially among those building pure software products.
Five cybersecurity best practices to follow in 2019
Research by Cybersecurity Ventures predicts ransomware alone will cost businesses around the world more than $11.5 billion in 2019. What’s worse, this same study also predicts businesses will experience a cyberattack every 14 seconds by 2019, up from once every 40 seconds in 2016. So what can you do to mitigate the increasing threat of cyberattacks? Here are five IT security best practices that can help.
Named Entity Extraction with OpenNLP
We recently had a presentation at Activate 2018 about entity extraction in the context of a product search. For example: how to tell, when the user typed in Activate 2018, that the intent was to run conference:Activate AND date:201
Grafana 5.3.3 and 4.6.5 released with important security fix
Today we are releasing Grafana 5.3.3 and 4.6.5. These patch releases include an important security fix for all Grafana installations between 4.1.0 and 5.3.2. We also release 5.3.4 at the same time containing some fixes and improvements that we have been holding off for a while to release 5.3.3.
Paul Dix [InfluxData] | View from the CTO | InfluxDays 2018
Falco 0.13.0 Released: Kubernetes Audit Events Support
We recently released Falco 0.13.0, which is probably the most exciting release since Falco’s 0.1.0 release almost two and a half years ago. With 0.13.0, we’re adding support for a second stream of events — Kubernetes Audit Events. This release also lays the groundwork for additional event sources to be easily added.
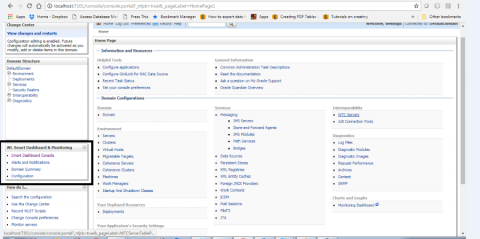
WebLogic Smart Dashboard and Monitoring-A Tool for WebLogic Administrators by Rounak Agrawal
I have been working on WebLogic server for more than 3 years. I do monitor server log files, Server status, Data source , JMS servers, deployed application status, CPU/Memory usage and much more J2EE applications related metrics. This was a repetitive task for me checking manually everything on console .I always thought of writing some scripts , even i wrote one Jython script which was giving HTML formatted report.


