Operations | Monitoring | ITSM | DevOps | Cloud

For Developing a Healthy IoT Device Fleet: Master These 3 Metrics

Discover the three essential metrics that reveal your device's true health, from stability and connectivity to battery life. In our latest clip, François Baldassari explains how tracking these vital signs can preemptively alert you to potential issues and empower you to take action before it's too late.

Linux Coredumps (Part 2) Shrinking the Core

In our previous article, we outlined what a Linux coredump is and how they work under the hood. One common constraint we see in embedded Linux, however, is a limited amount of storage space. Whether we’re trying to limit writes to disk, or need to reserve most of the disk space available to a device for other data, sometimes we just don’t have enough space to store coredumps.

Monitor and Debug Laravel Applications with Sentry

Join me for a hands-on workshop where we'll debug real-world issues in a Laravel and React application using Sentry. We'll tackle three common production problems: You'll learn how to use Sentry's powerful tools including: Performance monitoring and tracing Error context enrichment Seer AI for root cause analysis Session Replay and Breadcrumbs By the end, you'll be equipped to debug complex issues in your own applications with confidence!

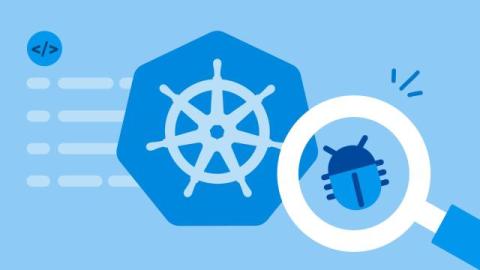
The Guide to Kubernetes Debugging

Kubernetes is widely used for deploying, scaling, and managing systems and applications and is an industry standard for container orchestration. Google engineers originally developed Kubernetes as an open-source project. Its first release was in September 2014, and since then, it has matured into a graduate project maintained by the Cloud Native Computing Foundation (CNCF). With the complexities of scale and distributed systems, debugging in Kubernetes environments can be difficult.

Sentry's AI debugger now references traces for troubleshooting distributed systems

Debugging is an ever-present pain for all developers, and that will continue despite, or maybe even thanks to, the rise of AI-written code. Tools like Sentry have been around for a while to help us engineers track and debug issues, but it’s tempting to make that process even faster and easier with some shiny new AI tools. Sure, I could just copy-paste the exception’s stack trace from Sentry into ChatGPT, but what if I really wanted something smart?

Coredump #007: AI, Open Source, & the Future of Embedded Development

In today's Coredump Session, we dive into a wide-ranging conversation about the intersection of AI, open source, and embedded systems with the teams from Memfault and Goliath. From the evolution of AI at the edge to the emerging role of large language models (LLMs) in firmware development, the panel explores where innovation is happening today — and where expectations still outpace reality. Listen in as they untangle the practical, the possible, and the hype shaping the future of IoT devices.

Application Debugging in Sentry with Flags, Tracing, and Seer

In this video, Cody takes you on a tour or fixing problems in the Unborked marketplace using Flags, Traces, and Seer! Sentry is all about giving you options when it comes to debugging - whether its using the dev toolbar to manage feature flags on the fly, using replays and tracing to dive deep into whats happening in your application, or even using Seer (in beta) to pull all the context from your application together - everything from traces, to errors, to stack traces and more - and give you a root cause of what went wrong, and pull a PR to fix it.

Why Software Observability is Key for Device Success

As devices become more software-driven, ensuring quality isn't just a good practice—it's essential. Discover why François Baldassari believes that observability is the secret weapon in navigating software complexity and avoiding major incidents. Explore how staying ahead in this evolving landscape can revolutionize edge computing.

Why Uptime Is The Magic Metric For Every Industrial IoT Fleet

When industrial devices go down, entire operations can grind to a halt. François Baldassari, CEO of Memfault, breaks down why uptime should be a core metric—and how embedded observability helps you get there. Learn how to chip away at reliability issues, identify root causes fast, and avoid costly downtime. Memfault gives embedded teams a better way to monitor, debug, and update connected devices. Discover what’s possible when you close the visibility gap.