JavaScript is one of the most widely used programming languages for creating dynamic, interactive websites. However, there may be instances where a function is not operating as intended because of a coding error while creating JavaScript projects. Therefore, the majority of developers hunt for JavaScript debugging tools to avoid problems and identify errors before execution.
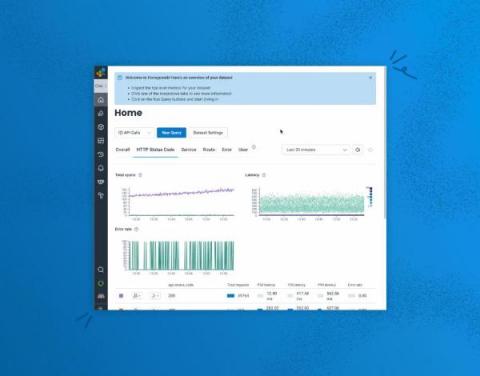
BubbleUp is Honeycomb’s machine-assisted debugging feature and is one of our most powerful differentiators. It leverages machine analysis to cycle through all of the attributes found in billions of rows of telemetry to surface what is in common with problematic data compared to baseline data. This explains the context of anomalous code behavior by surfacing exactly what changed when you don’t know which attributes to examine or index, dramatically accelerating the debugging process.
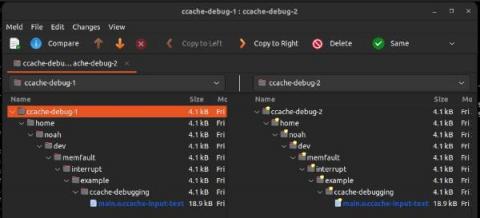
This article provides a few tips and tricks for diagnosing ccache misses, to keep your C/C++ build nice and snappy!
Debugging is an unavoidable part of software development, especially in production. You can often find yourself in “debugging hell,” where an enormous amount of debugging consumes all your time and keeps the project from progressing. According to a report by the University of Cambridge, programmers spend almost 50% of their time debugging. So how can we make production debugging more effective and less time-consuming?
As a developer, Python for me is a heavy-lifting and versatile language. I’ve used it for building APIs, internet of things projects, file and data conversions, machine learning and (of course) web development. Like with any modern, commonly used language, the functionality behind the application is only as good as the infrastructure that it is deployed onto.