Operations | Monitoring | ITSM | DevOps | Cloud

Google Operations

Optimizing and Troubleshooting Your Application, the Google Way (Cloud Next '18)

In this session, you’ll learn about the value of these kinds of tools, how you can automatically extract telemetry from your app with OpenCensus, and will receive a demonstration of how to solve customer issues in a multi-cloud deployment with Stackdriver APM and other tools supported by OpenCensus.

Improving Reliability with Error Budgets, Metrics, and Tracing in Stackdriver (Cloud Next '18)

Members of the Stackdriver and Customer Reliability Engineering teams will demonstrate how Stackdriver tooling inspired by the needs of SREs at Google brings you the ability to run services more reliability and with fewer false positive signals through tracking and alerting upon error budgets and debugging with the exemplar technique during an outage.

How to connect Stackdriver to external monitoring

Google Stackdriver lets you track your cloud-powered applications with monitoring, logging and diagnostics. Using Stackdriver to monitor Google Cloud Platform (GCP) or Amazon Web Services (AWS) projects has many advantages—you get detailed performance data and can set up tailored alerts. However, we know from our customers that many businesses are bridging cloud and on-premises environments.

Try full-stack monitoring with Stackdriver on us

In advance of the new simplified Stackdriver pricing that will go into effect on June 30, we want to make sure everyone gets a chance to try Stackdriver. That’s why we’ve decided to offer the full power of Stackdriver, including premium monitoring, logging and application performance management (APM), to all customers—new and existing—for free until the new pricing goes into effect. This offer will be available starting June 18.

Gain visibility and take control of Stackdriver costs with new metrics and tools

A few months back, we announced new simplified Stackdriver pricing that will go into effect on June 30. We’re excited to bring this change to our users. To streamline this change, you’ll receive advanced notifications and alerting on the performance and diagnostics data you track for cloud applications, plus flexibility in creating dashboards, without having to opt in to the premium pricing tier.

Stackdriver brings powerful alerting capabilities to the condition editor UI

We are excited to announce the beta version of our new alerting condition configuration UI. In addition to allowing you to define alerting conditions more precisely, this new UI provides an easier, more visual way to find the metrics to alert on. The new UI lets you use the same metrics selector as used in Stackdriver’s Metrics Explorer to define a broader set of conditions. Starting today, you can use that metrics selector to create and edit threshold conditions for alerting policies.

Getting more value from your Stackdriver logs with structured data

Logs contain some of the most valuable data available to developers, DevOps practitioners, Site Reliability Engineers (SREs) and security teams, particularly when troubleshooting an incident. It’s not always easy to extract and use, though. One common challenge is that many log entries are blobs of unstructured text, making it difficult to extract the relevant information when you need it.

Announcing Stackdriver Kubernetes Monitoring: Comprehensive Kubernetes observability from the start

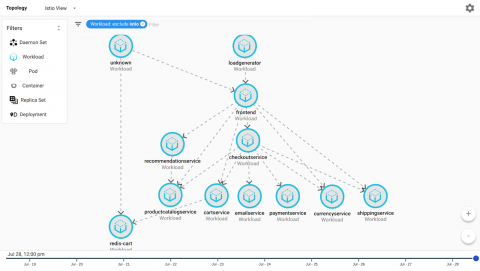
Today, we are excited to announce the beta release of Stackdriver Kubernetes Monitoring, which lets you observe Kubernetes in a comprehensive fashion, simplifying operations for both developers and operators.