Operations | Monitoring | ITSM | DevOps | Cloud

Platform Engineering - Empowering Developers with Self-Service Tools

In the world of DevOps and cloud engineering, a new buzzword has emerged: Platform Engineering. This concept has sparked discussions across the industry, with professionals debating whether it replaces traditional DevOps or adds value to it. In reality, Platform engineering transforms how software teams work. It builds on DevOps principles to create self-service tools that boost developer productivity. This approach streamlines workflows, enhances security, and cuts operational costs.
OpenTelemetry vs. OpenTracing - Decoding the Future of Telemetry Data

OpenTelemetry and OpenTracing are open-source projects used to instrument application code for generating telemetry data. While OpenTelemetry can help you generate logs, metrics, and traces, OpenTracing focuses on generating traces for distributed applications. If you’re thinking of choosing between OpenTelemetry and OpenTracing, go for OpenTelemetry. OpenTracing is now deprecated, and users of OpenTracing are advised to migrate to OpenTelemetry.

OpenTelemetry vs Datadog - Choosing the Right Monitoring Tool

OpenTelemetry and DataDog are both used for monitoring applications. While OpenTelemetry is an open source observability framework, DataDog is a cloud-monitoring SaaS service. OpenTelemetry is a collection of tools, APIs, and SDKs that help generate and collect telemetry data (logs, metrics, and traces). OpenTelemetry does not provide a storage and visualization layer, while DataDog does.

Prometheus vs InfluxDB - Key Differences, concepts, and similarities

Prometheus and InfluxDB are open-source projects created to make application performance monitoring a breeze. That is, of course, if you choose the option that covers your entire observability scope. This article compares and contrasts the extent to which Prometheus and InfluxDB remedy the need for real-time insights into your applications’ operations. We’ll highlight similarities and overlaps in both usability and practicality.

Python Flask instrumentation using OpenTelemetry | SigNoz

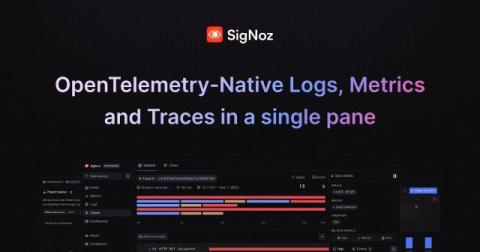
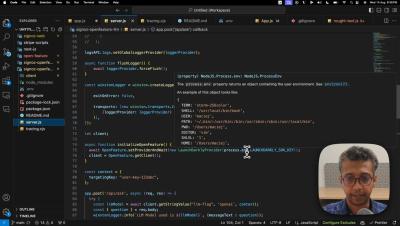
In this video, you will learn how to instrument your Python Flask application using OpenTelemetry and monitor your trace data in SigNoz. Link to Document used in this video More about SigNoz: SigNoz - Monitor your applications and troubleshoot problems in your deployed applications, an open-source alternative to DataDog, New Relic, etc. Backed by Y Combinator. SigNoz helps developers monitor applications and troubleshoot problems in their deployed applications. SigNoz uses distributed tracing to gain visibility into your software stack.

Top 11 Splunk Alternatives in 2024 [Includes Free & Open-Source Tools]

Splunk is a powerful unified security and observability tool that analyzes data and logs. Splunk allows you to monitor and visualize data in real-time. It analyzes machine-generated data and logs through a web interface. It was acquired by Cisco in a $28 billion deal. While Splunk is a powerful platform, it might not suit your needs. In this post, we discuss 11 top Splunk alternatives that you can consider. Splunk provides a wide range of tools for analyzing and visualizing your data fast and at scale.

How to achieve Observability for Microservices-based apps using Distributed Tracing?

Modern digital organizations have rapidly adopted microservices-based architecture for their applications. Microservices-based apps have components designed around business capabilities serving a specific purpose. It enables smaller engineering teams to own specific services that lead to increased productivity. But componentization also leads to complexity. Today’s modern internet-scale businesses have hundreds or thousands of microservices.