Operations | Monitoring | ITSM | DevOps | Cloud
Datadog On Maintaining eBPF at Scale
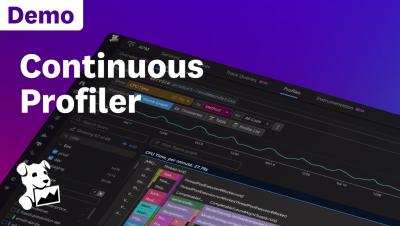
Datadog Continuous Profiler Demo
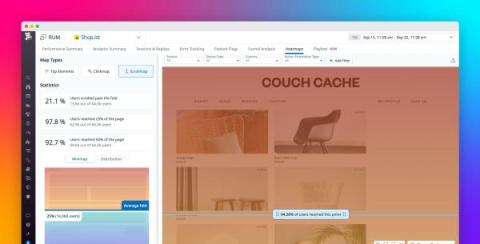
Visualize user interactions with your pages by using Scroll Maps in Datadog Heatmaps
When developing modern applications, product managers, designers, and website developers need to understand how users interact with web pages in order to guide those users through their desired journeys. For example, teams need to know if users ever see the content near the bottom of the page, where to place CTAs to ensure they are in high-traffic areas, and how to compare different pages based on user engagement.
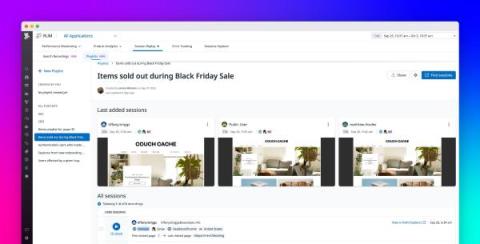
Organize and analyze related session replays with Playlists in Datadog RUM
Datadog Session Replay in Real User Monitoring (RUM) enables customers to capture and visually replay the web and mobile experience of their end users. With Session Replay, customers can quickly find and address UX errors by seeing precisely what actions an end user took, the point where they got stuck, and the outcome encountered as a result. Session Replay allows for easier troubleshooting and debugging because it delivers visible, insightful context into frontend errors.
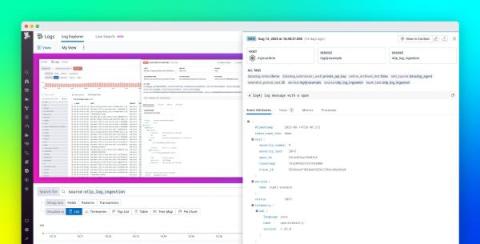
Ingest OpenTelemetry logs with the Datadog Agent
OpenTelemetry (OTel) is an open-source, vendor-neutral observability solution that provides a suite of components—including APIs, SDKs, and a data collector—that enable teams to collect and communicate telemetry data from cloud-native applications and services. OTel also defines the OpenTelemetry Protocol (OTLP), a standard for the encoding and transfer of telemetry data.
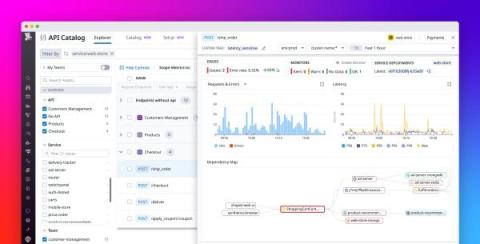
Manage API performance, security, and ownership with Datadog API Catalog
Today’s modern applications are made up of thousands of loosely connected private and publicly exposed APIs, each serving a specific function. This dynamic API landscape, in combination with the decentralized nature of microservice development, can be overwhelmingly challenging to manage—let alone govern or secure adequately. API sprawl is often created as a result, leading to fragmented or nonexistent internal API documentation, knowledge bases, and toolsets.
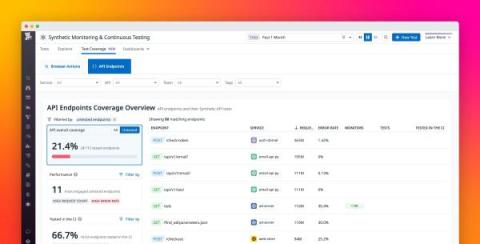
Improve your API test coverage with Datadog Synthetic Monitoring
As your applications grow, your teams may be faced with managing a complex, expanding mesh of potentially thousands of loosely connected APIs—each one a new point of failure that can be difficult to track and patch. API sprawl comes naturally in rapidly expanding, distributed applications, and the difficulty of maintaining centralized knowledge and toolsets for your APIs creates friction when teams need to leverage APIs they don’t own.
Best practices for creating custom detection rules with Datadog Cloud SIEM
In Part 1 of this series, we talked about some challenges with building sufficient coverage for detecting security threats. We also discussed how telemetry sources like logs are invaluable for detecting potential threats to your environment because they provide crucial details about who is accessing service resources, why they are accessing them, and whether any changes have been made.
Monitor your Boomi integrations with Kitepipe's offering in the Datadog Marketplace
Boomi is a cloud-based integration platform that helps customers connect their applications, data sources, and other endpoints. But monitoring and troubleshooting Boomi Atoms—the runtime engines for Boomi integration processes—and the applications connected to them can be a challenge. Boomi automatically purges logs after 30 days, and users must frequently correlate data from various disconnected sources for visibility into their Boomi processes.


