Operations | Monitoring | ITSM | DevOps | Cloud

%term

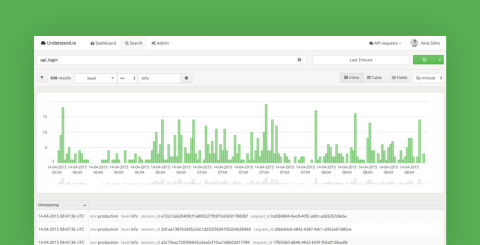
Understand.io – Online Event and Log Management

Applications logs are a critical factor in helping ensure that your online applications are running at their best. By using Understand.io you can get deep visibility into your applications in real-time, helping you to easily track down error messages, application requests, customer problems, and much more.

Automate and schedule shutdowns in Microsoft Azure without powershell.

See how to use the Azure Virtual Machine Scheduler and save time and money within Azure subscription. Automate and schedule the shutdown and power back on of your virtual machines within Microsoft's Azure Cloud with ease. Download a free 30 day trial and test it for yourself now.

The Met Office - Manager of Managers - a Video Case Study

A 5-minute video featuring Hilary Palmer, manager of the Met Office’s Service and System Monitoring team and technical lead, Eddy Hemmings. Across the world, every single day, people make decisions based on the weather. The Met Office produces over 4 million forecasts every day; providing weather and climate forecasts to help with those decisions - to enable protection, well-being and support the economy. The Met Office’s Service and System Monitoring Team provide the organisation with real time monitoring of application, data and infrastructure components that are vital to the delivery of Met Office services to their customers. IT staff within the Operations Centre, need to have visibility in to the events that occur in their environment, knowing how and when to deal with these events and be able to act proactively and quickly. The consolidated view the Manager of Managers (MOM) provides facilitates this - in a single pane of glass. Without it failures may occur that bring the business to a halt.

Learn how to make use of Site24x7 Reports

Site24x7 offers unified cloud monitoring for DevOps and IT operations. Monitor the experience of real users accessing websites and applications from desktop and mobile devices. In-depth monitoring capabilities enable DevOps teams to monitor and troubleshoot applications, servers and network infrastructures, including private and public clouds. End-user experience monitoring is done from 50+ locations across the world and various wireless carriers.

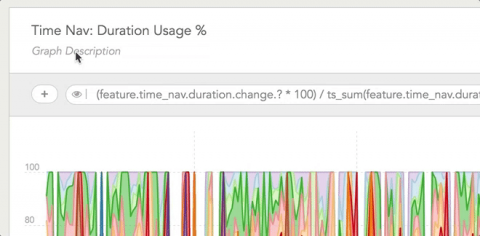
Server & Application Monitoring Pricing Comparison: Instrumental, New Relic, Datadog, Librato, and SignalFx

Confused about the price of an application and server monitoring tool? So were we! Every tool is priced differently and there are a lot of nuances. We’ll walk you through important terminology differences, the pros and cons of different plans, and then discuss the pricing details for Librato, New Relic, SignalFX, Datadog, and of course, Instrumental.

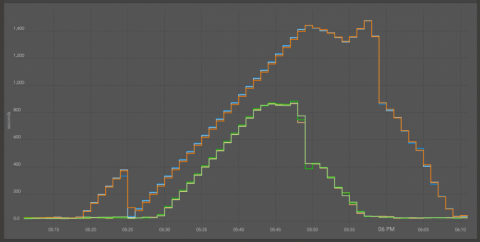
Node.js Application Performance Monitoring

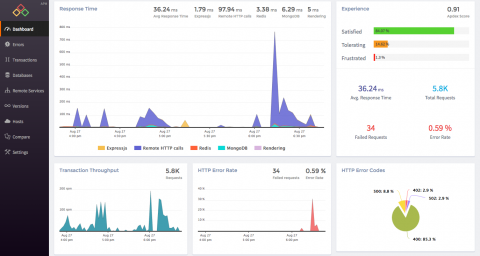
Atatus is a comprehensive application performance management (APM) suite for Node.js applications. Atatus Node.js APM gives you the deeper visibility into the every web transactions happened in your Node.js apps. With Atatus, you can identify the slowest web transactions and see where your web requests are spending time whether it is in the database, remote services or middlewares. Atatus makes Node.js monitoring simpler and easier.