Operations | Monitoring | ITSM | DevOps | Cloud
Honeycomb Distributed Tracing
Graph Observability: Honeycomb and Apollo GraphQL With OpenTelemetry
HoneyByte: Using Application Metrics With Prometheus Clients
Have you ever deep dived into the sea of your tracing data, but wanted additional context around your underlying system? For instance, it may be easy to see when/where certain users are experiencing latency, but what if you needed to know what garbage collection is mucking up the place or which allocated memory is taking a beating? Imagine having a complete visual on how an application is performing when you need it, without having to manually dig through logs and multiple UI screens.
Ask Miss O11y: Load Testing With Fidelity
Hey Perplexed, We’re huge advocates for testing in production, and that includes performing chaos engineering/continuous verification in production. But you’re right to want to be cautious about exactly how you are performing these tests. After all, it’s chaos engineering, not just pure unbridled chaos.
Tracing makes a bug easy to spot
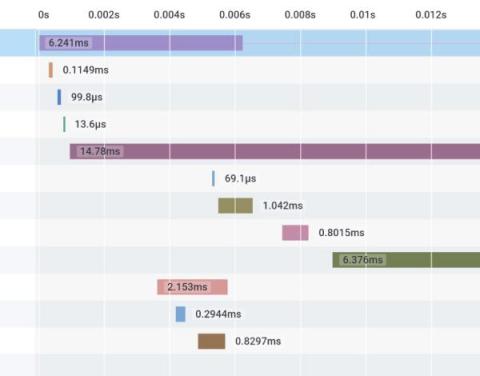
Today, I found a bug before I noticed it. Like, it was subtle, and so I wasn’t quite sure I saw it—maybe I hadn’t hit refresh yet? Later, I looked at the trace of my function and, boom, there was a clear bug. Here’s the function with the bug. It responds to a request to /win by saving a record of the win and returning the total of my winnings so far. Can you spot the problem in the TypeScript? It’s subtle. Now here’s a trace in Honeycomb: Now do you see the bug?
Ask Miss O11y: Tracing Is for Async, Too
I have a good sense of how to use traces to understand my system’s behavior within request/response cycles. What about multi-request processes? What about async tasks spawned within a request? Is there a higher-level or more holistic approach?
Scaling Kafka at Honeycomb
When you send telemetry into Honeycomb, our infrastructure needs to buffer your data before processing it in our “retriever” columnar storage database. For the entirety of Honeycomb’s existence, we have used Apache Kafka to perform this buffering function in our observability pipeline.
OpenTelemetry Browser Instrumentation
One of the most common questions we get at Honeycomb is “What insights can you get in the browser?” Browser-based code has become orders of magnitude more complex than it used to be. There are many different patterns, and, with the rise of Single Page App frameworks, a lot of the code that is traditionally done in a backend or middle layer is now being pushed up to the browser. Instead, the questions should be: What insights do frontend engineers want?
Ask Miss O11y: Mapping Out Your Observability Journey
Dear Trapped, Thanks for asking the question! Approaching observability as an all-or-nothing problem often leads to the project feeling daunting. But that’s not specific to observability—any project can be overwhelming if you think it needs to be done all at once, perfectly. Such as, erm, writing an entire book on observability! *looks around worriedly*


