Operations | Monitoring | ITSM | DevOps | Cloud
DevOps Security: Challenges and Best Practices
With the shift from traditional monolithic applications to the distributed microservices of DevOps, there is a need for a similar change in operational security policies. For example, how do you secure a disparate number of micro-systems operating with multiple access credentials across a multi-level organization? DevSecOps (Devops security) answers this question by integrating security at every level of your development process.
How to Configure the OTel Community Demo App to Send Telemetry Data to Coralogix
If you’re just getting familiar with full-stack observability and Coralogix and you want to send us your metrics and traces using the new OpenTelemetry Community Demo Application, this blog is here to help you get started. In this simple, step-by-step guide, you will learn how to get telemetry data produced by the OpenTelemetry Demo Webstore into your Coralogix dashboard using Docker on your local machine.
Coralogix Makes Observability Collaborative
In the world of observability, there are several distinct problems to solve. Fast queries, intuitive visualizations, scalable storage, and more. The technical problems receive the most attention; however, there is another, more subtle problem. How do observability platforms facilitate collaboration on the scale needed by organizations?
Application Performance Monitoring in the Gaming Industry
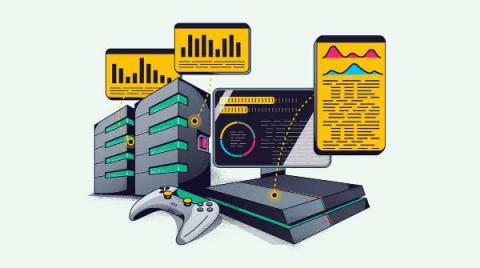
The gaming industry delivers specialized software at scale to users who expect a flawless interface. Application performance monitoring (APM) will measure critical software performance parameters using telemetry data. By monitoring this data, teams can ensure their game delivers the best user experience and quickly detect when the software needs updates to fix errors or meet key performance indicators (KPIs).
Observability and Its Influence on Scrum Metrics
Scrum metrics are an essential indicator of your team’s progress. In an agile team, they help you understand the pace and progress of every sprint, ascertain whether you’re on track for timely delivery or not, and more. Although scrum metrics are essential, they are only one facet of the delivery process — sure, they ensure you’re on track, but how do you ensure that there are no roadblocks during development? That’s precisely where observability helps.
Can Observability Push Gaming Into the Next Sphere?
The gaming industry is an extensive software market segment, reaching over $225 billion US in 2022. This staggering number represents gaming software sales to users with high expectations of game releases. User acquisition takes up a large part of software budgets, with $14.5 billion US spending globally in 2021. User retention is critical to the success of any game, especially where monetization requires driving in-app purchases and ad revenue.
Python Data Analysis for Finance: Analyzing Big Financial Data
Python has staked its claim as the most popular programming language among developers worldwide. Accessible via Windows, Linux, and Mac, it’s intuitive and easy to read, and its use of maths lends itself perfectly to Python for finance and data analysis.
One Click Visibility: Coralogix expands APM Capabilities to Kubernetes
There is a common painful workflow with many observability solutions. Each data type is separated into its own user interface, creating a disjointed workflow that increases cognitive load and slows down Mean Time to Diagnose (MTTD). At Coralogix, we aim to give our customers the maximum possible insights for the minimum possible effort. We’ve expanded our APM features (see documentation) to provide deep, contextual insights into applications – but we’ve done something different.
AWS Lambda Telemetry API: Enhanced Observability with Coralogix AWS Lambda Telemetry Exporter
AWS recently introduced a new Lambda Telemetry API giving users the ability to collect logs, metrics, and traces for analysis in AWS services like Cloudwatch or a third-party observability platform like Coralogix. It allows for a simplified and holistic collection of observability data by providing Lambda extensions access to additional events and information related to the Lambda platform.


