Operations | Monitoring | ITSM | DevOps | Cloud

Grafana

GrafanaCONline: Slicing Kubernetes: Raspberry Pis, monitoring and chaos

Do you ever feel like your systems lack unnecessary complexity and overengineering? This is the talk for you. Join me as I detail the creation of a Raspberry Pi-based desktop Kubernetes cluster in an attempt to overcomplicate the already complex world of stateless web application deployment. We’ll walk through building an observability platform using open source tools like Prometheus, Grafana, and Jaeger to keep a close watch on our tiny fragile microservices and then break them intentionally for our own amusement.

GrafanaCONline: Industrial process monitoring: oil and gas industry

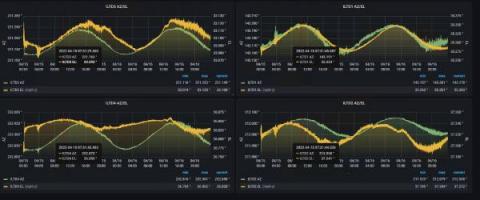
We have been utilizing Grafana at Whiting Oil and Gas for approximately three years. In that time, we have greatly impacted the way our field assets are managed through dashboards and alerting. Instead of servers and network data, Whiting is using the application to monitor oil and gas wells in remote locations. Historically, the energy industry has deployed very expensive tools to monitor assets and visualize data.

Grafana v7.0 released: New plugin architecture, visualizations, transformations, native trace support, and more

We are thrilled to announce that Grafana 7.0 has been released for general availability. Join us as Torkel Ödegaard, the creator of Grafana, hosts a full demo of 7.0 during GrafanaCONline today. With Grafana v7.0, our goal was to extend on the Grafana platform by making it easier and more consistent for existing users, and intuitive and simple for those not familiar with Grafana.

GrafanaCONline: Prometheus: what the future holds

It’s been nearly 2.5 years since Prometheus 2.0 released and 2 years since Prometheus graduated in the CNCF. You might say that clearly proves that Prometheus has become mainstream. However, that doesn’t mean Prometheus would be “done” now. The developer community is more active than ever. Let’s have a look at the highlights of the past year and at the things on the roadmap. The speaker is one of the Prometheus developers and would also be delighted to hear from you what you want to see next in Prometheus.

GrafanaCONline: Strava: the Venn diagram of observability

In the era of services architecture, reliability engineering, and container orchestration, the word “observability” is widely used but rarely clearly defined. What is “observability” really? Of the various observability concepts and tools, what are the distinctions and overlaps in various technologies?

GrafanaCONline Day 2 recap: The future of worldPing and an industrial IoT use case of Grafana

GrafanaCONline is live! We hope you’re able to catch the great online sessions we have planned over the next couple of weeks. After Grafana creator Torkel Ödegaard, Grafana Labs CEO Raj Dutt, and VP of Product (and Cortex co-creator) Tom Wilkie kicked off the conference with a keynote discussing the future of Grafana and the upcoming Grafana 7.0 release, GrafanaCONline continued with a focus on Grafana’s global reach.

GrafanaCONline Day 1 recap: Opening keynote with Grafana Labs leadership

GrafanaCONline is live! We hope you’re able to catch the great sessions we have planned over the next couple of weeks. The conference kicked off yesterday with a keynote from Grafana creator Torkel Ödegaard, Grafana Labs CEO Raj Dutt, and VP of Product (and Cortex co-creator) Tom Wilkie.