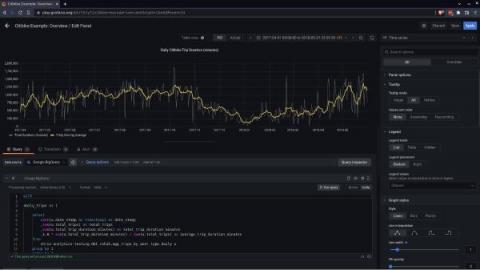
How to pull Oracle data and stats directly into Grafana dashboards with the Oracle Enterprise plugin
Grafana’s plugins are a quick and simple way to extend Grafana’s dashboard plugins and data sources.
Today, we are announcing the Grafana Cloud Agent, a subset of Prometheus built for hosted metrics that runs lean on memory and uses much of the same battle-tested code that has made Prometheus so awesome. At Grafana Labs, we love Prometheus. We deploy it for our internal monitoring, use it alongside Alertmanager, and have it configured to send its data to Cortex via remote_write. Unfortunately, as we scale to handle more load, our deployment becomes more and more difficult to manage.
The Grafana v6.7 stable release includes improvements to Authorization and Enterprise reporting as well as a new plugin for Google Sheets. Check out the details below.
With every tech company on Earth suddenly pretending they’re remote-friendly overnight, there are a lot of posts about how to work well from home. As a matter of fact, we wrote our own, so why would we write another? The answer is: kids.
At FOSDEM 2020, Grafana Labs software engineers Tom Braack and Malcolm Holmes explained how and why the team developed Tanka, a scalable Jsonnet-based tool for deploying and managing Kubernetes infrastructure. They also shared how Grafana Labs leverages the project to manage and monitor its own infrastructure as well as showcased how Tanka makes deploying a Grafana instance faster and more efficient.
You’re done setting up your first graph panels. You want to do more, look around the visualization settings, and discover the settings for the X and Y axes. You stumble over the configuration for a “Right Y” axis. You ask yourself, “Why on earth would I need another Y axis?” You toggle it back and forth and change some settings, yet that makes no difference to your graph. What gives? Never fear.
Certificates can be difficult to track and opaque to administrators, and if any expire without someone noticing, embarrassing outages can happen. At Grafana Labs we strive to make all things visible and observable; why should certificates be any exception? In this post we will explore an easy way to expose and monitor certificate expirations using Grafana and Prometheus.
Grafana Labs cofounder and CEO Raj Dutt was a recent guest on the Designing Enterprise Platforms podcast from Early Adopter Research (EAR), speaking to host Dan Woods about the benefits of observability. The conversation touched on several related topics – including the tactics of observability, platform approaches, and why now is a great time to be part of an open source company.
There has long been a request from administrators to have the ability to enforce a minimum interval between alert rule evaluations. This is useful for restricting unrealistic user-defined alert rules that evaluate too often and create unnecessary load in the backend. @Uepoch took the initiative and made all the necessary modifications for this configuration in Grafana’s backend, and we finally pushed it forward and introduced the feature in Grafana v6.6.