Operations | Monitoring | ITSM | DevOps | Cloud

Grafana

What's Next for Observability

In the industry, the long-held theory behind observability is that a successful stack consists of three key components – metrics, logging, and tracing. “This is a mental model for people who are often new to observability which helps them get a handle on what they need to implement to be successful,” said Grafana Labs VP of Product Tom Wilkie during a keynote presentation he delivered at KubeCon + CloudNativeCon EU in May alongside Red Hat Software Engineer Frederic Branczyk.

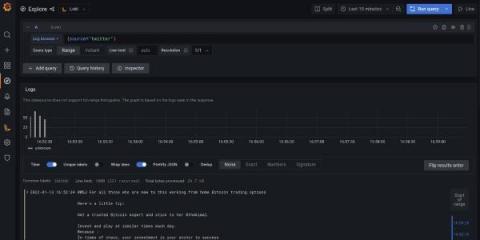
New in Grafana 6.4: The Logs Panel

At Grafana Labs, we are working to make it easier to visualize data that comes from many different sources and in many different ways. We know that our customers are usually using more than one system to track what’s going on within an infrastructure. If you are a system administrator, or even a curious developer, there is a very high probability that you are monitoring and quite regularly reviewing your logs to find valuable and important information in them.

What It's Like Working Remotely as a Junior Dev

I am a junior software engineer in Slovakia. I feel incredibly lucky that I’ve had this amazing opportunity to join Grafana Labs, as it was among the top companies that I’ve ever dreamed about working for. The only thing that I was slightly scared of was the fact that Grafana Labs is remote-first, and I would be working full-time from home.

How to Do Effective Infrastructure Monitoring for Linux with Grafana

Grafana Labs has 8+ clusters in GKE running 270 nodes of various sizes, and all the hosted metrics and hosted log Grafana Cloud offerings are run on 16-core, 64-gig machines. At the recent All Systems Go! conference in Berlin, David Kaltschmidt, Director, User Experience, gave a talk about what monitoring these clusters and servers looks like at Grafana Labs and shared some best practices.

New Resources for Contributors to the Grafana Project

Earlier this month, Ivana Huckova, one of Grafana’s junior developers, wrote an article about how to contribute to Grafana as a junior dev. As an open-source project supported by engineers around the world, Grafana strongly encourages anyone to contribute. And ICYMI, there are many opportunities to help: Testing the UI and reporting issues, finding and fixing bugs, and improving the documentation are just a few.

Grafana Labs at 5: How We Got Here and Where We're Going

In the beginning, there was a developer using Graphite, and he found its user interface lacking. Then he discovered the Kibana project, liked its UI, and forked it. Grafana was born in 2013. “I started Grafana to do something similar as Kibana, but focused on time series metrics. My goal was to make time series data accessible for a wider audience, to make it easier to build dashboards, to make graphs and dashboards more interactive,” says Torkel Ödegaard.

Deduping HA Prometheus Samples in Cortex

One of the best practices for running Prometheus in production environments is to use a highly available setup, in which multiple Prometheus instances all scrape the same targets. This means multiple instances have all your metrics data, so if one fails, the data is still available on another. Ideally, each instance would run on a separate machine.

Behind the Grafana UX: Redesigning the Thresholds Editor

As part of building the new Gauge panel in React, we also wanted to update the panel controls, especially the thresholds control. A threshold in the context of Grafana is simply a value that, when exceeded, a condition occurs. An example would be a single stat panel with a green background that changes its background color to red when a threshold is breached.