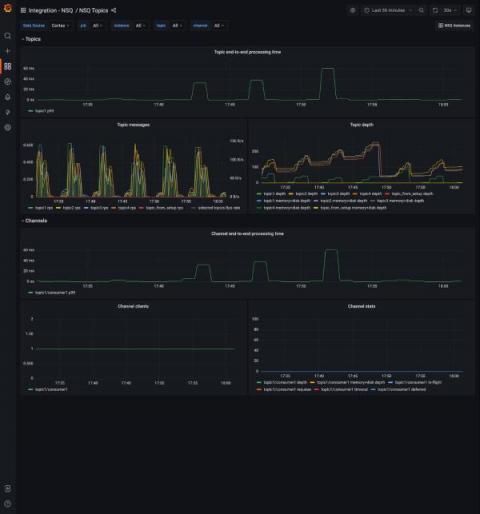
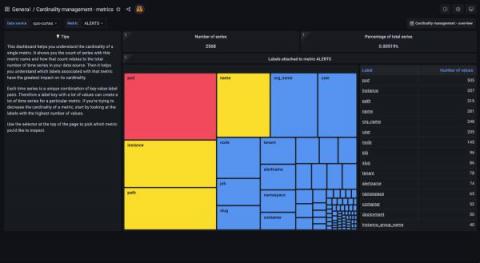
Metrictank exposes many metrics to aid with operating the software in production. As the metrictank team (the primary on-call team for metrictank at Grafana Labs) grows and onboards new people, and more customers deploy the software on their premises, we need to solve a few problems regarding the metrics exposed by metrictank.
You might have seen a few of my tutorial videos on Grafana and Grafana Loki. If not, check them out here. These videos are a bit of an experiment to showcase the awesome work being done by the Grafana OSS community and for me to understand the technology better. I got a lot of encouraging feedback on the videos, so I plan to continue making them. A few folks also wanted to know why and how I created them. Happy to share the details here with you, and I look forward to your Grafana videos :)
Prometheus’s TSDB (TimeSeries DataBase) stores the recent data in the memory and the old data on persistent storage in the form of blocks. Each block has its own index to map the series to the actual chunks that contain the data samples. During Google Summer of Code 2019, I mentored Alec Wang throughout this work on lifting the size limitations of the index mentioned above. The work described below is up for review and should be merged soon.
We’re always looking for ways to improve the Grafana UX; recently, we’ve been working on redesigning form styles. The three key areas of improvement are accessibility, scannability, and appeal. They’re very much intertwined, and things like inconsistency affect all of them. Here’s a look at our design process so far.
We saw Cameron’s impressive dashboard in a Grafana Experts Facebook group and asked him to break it down for us. When friends and visitors see my personal home dashboard in my kitchen, they’re normally of the opinion that it’s “really neat” and looks “impressive.” Often that’s what they take away from it. It’s “cool”… and as much as that may be true, that is not its purpose.
More frequent releases! We continue to march Loki towards the first GA release, and to help that process we are going to target bi-weekly to weekly releases, depending on changes. - Ed Welch 08/12/2019 My mistake, there was clearly a typo in my previous post, and when I said bi-weekly I clearly meant bi-monthly. ;) The good news, however, is that the project has been very busy and there are some very exciting new features in Loki v0.4.0!
This morning, we announced that Grafana Labs has raised $24 million in Series A funding. Here’s what that means for our open source community. Our company was established five years ago to accelerate the adoption of the Grafana project and to build a sustainable business around it, which could in turn help support the community.
Grafana Labs turned 5 on Oct. 4. And as a remote-first company, we decided it would be a great excuse to give our team members, who are scattered across 22 different countries, a chance to take their conversations off Slack and celebrate together in person. In London, Berlin, Stockholm, New York City, and Bangalore, Grafana Labs engineers, sales teams, solutions staff, HR, and marketing – everyone! – gathered to meet and mingle, to reconnect and reminisce.