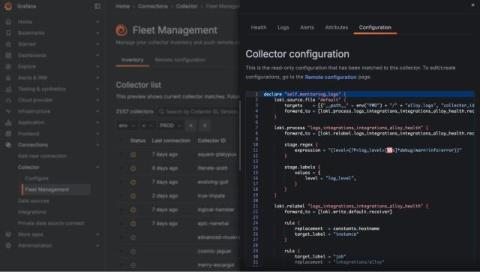
The macro economy can put a lot of pressure on organizations to reduce costs, typically with the central SRE and platform engineering teams coming under scrutiny. One common workaround we’ve seen countless teams make is compromising their observability by ingesting fewer metrics in the name of cost savings. But for centralized SRE/observability teams, the response to macro conditions should not be monitor less, but rather monitor smarter.
Grafana 10.1 is here! The latest Grafana release introduces new features and improvements that help deepen your observability insights in Grafana, including an improved flame graph, a new geomap network layer, simplified alerting workflows, and more. Grafana 10.1: Download now! For an overview of all the features in this release, check out our What’s New documentation. And to learn the details about all the Grafana 10.1 updates, read our changelog for more information.
Grafana k6 v0.46.0 is here! The new release features the ability to configure TLS, new usage reports and PDF reports in Grafana Cloud, and tons of improvements for Grafana k6 OSS and Grafana Cloud k6. Here’s an overview of Grafana k6 v0.46.0, as well as some other important updates from the k6 team and community.
Grafana Loki is an open source logs database built on object storage services in the cloud. These services are an essential component in enabling Loki to scale to tremendous levels. However, like all SaaS products, object storage services have their limits — and we started to crash into those limits in Grafana Cloud Logs, our SaaS offering of Grafana Loki.
Over the past six months, we have been working on optimizing query performance in Grafana Mimir, the open source TSDB for long-term metrics storage. First, we tackled most of the out-of-memory errors in the Mimir store-gateway component by streaming results, as we discussed in a previous blog post. We also wrote about how we eliminated mmap from the store-gateway and as a result, health check timeouts largely disappeared.
Victor Sonck is a Developer Advocate for ClearML, an open source platform for Machine Learning Operations (MLOps). MLOps platforms facilitate the deployment and management of machine learning models in production. As most machine learning engineers can attest, ML model serving in production is hard. But one way to make it easier is to connect your model serving engine with the rest of your MLOps stack, and then use Grafana to monitor model predictions and speed.
Each year, more than 296 million packages are shipped around the world via DHL and their premium service, Time Definite International. And at DHL Express Switzerland, a local unit of the international logistics and shipping company, the IT team provides solutions for tracking customs clearance progress, analytics, mobile and optical character recognition (OCR) scanning, and warehouse management on every package that moves through Switzerland.
I’ve had a swimming pool at my house in Massachusetts since 2016. One of the problems that pool owners like myself face when we go on vacation or leave for several days is evaporation from the pool and the water level dropping below the skimmers. This can happen due to sunlight and warm temperatures. It can also happen when temperatures drop at night and the pool is being heated — the water temperature is warmer than the air, causing the water to evaporate.