Operations | Monitoring | ITSM | DevOps | Cloud

Grafana

How Qonto used Grafana Loki to build its network observability platform

Christophe is a self-taught engineer from France who specializes in site reliability engineering. He spends most of his time building systems with open-source technologies. In his free time, Christophe enjoys traveling and discovering new cultures, but he would also settle for a good book by the pool with a lemon sorbet.

Understanding Grafana k6: A simple guide to the load testing tool

Grafana k6 is a powerful, developer-friendly tool designed and engineered with a focus on load testing — but it boasts capabilities that extend far beyond that use case. Understanding the inner workings of k6 is helpful to fully leverage its potential, and to tailor the tool to your specific testing needs. Read on to learn how k6 is structured, and how its underlying design provides the best possible reliability and load testing experience.

Unify your observability signals with Grafana Cloud Profiles, now GA

Observability has traditionally been conceptualized in terms of three core facets: logs, metrics, and traces. For years, these elements have been seen as the “pillars” of observability, serving as the foundational components for system monitoring and delivering key insights to improve system performance. However, with the exponential growth in system complexity, a more comprehensive and unified perspective on observability has become necessary.

What's new in distributed trace visualization in Grafana

At Grafana Labs, we are constantly improving our feature set, and tracing is no different. Traces are often overshadowed by logs and metrics, but they’re a pillar of observability for a reason. Used correctly, organizations that can quickly and successfully follow a chain of events through a system gain a more holistic view of their systems and are better equipped to find and fix issues faster.

Managing Prometheus cardinality in Grafana Cloud: Adaptive Metrics FAQ

One of the most talked about topics in observability today is centered around the question of how to get more value out of the ever-increasing amount of data collected by agents, collectors, scrapers, and the like. Back in May, we announced Adaptive Metrics, a new feature in Grafana Cloud that allows you to reduce the cardinality of Prometheus metrics and the overall volume and costs of your metrics.

New in Grafana 10: Grafana Scenes for building dynamic dashboarding experiences

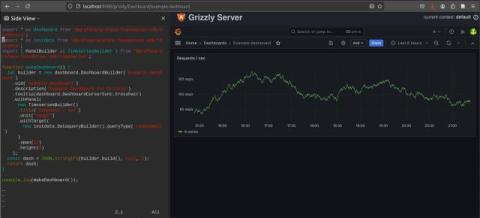
With Grafana 10, the latest major release of our data visualization platform, we wanted to explore new ways to empower our developer community. Case in point: Grafana Scenes, a new frontend library that enables developers to create dashboard-like experiences — such as querying and transformations, dynamic panel rendering, and time ranges — directly within their Grafana application plugins.

Grafana Tempo 2.2 release: TraceQL structural operators are here!

Get excited about Grafana Tempo 2.2! Not only is this release on time, but it is also chock full of TraceQL features and performance improvements. I was honestly a little shocked by how much we have accomplished in the last three months when summarizing the changelog.

Grafana Cloud Free: Actual stories about our 'actually useful' hosted free tier

It’s no secret that anyone can download our open source software and run it, because — once more with feeling — open source is in our DNA. But it can be hard to set up and configure a whole stack from scratch, which is why we offer Grafana Cloud as a fully managed observability platform.