Operations | Monitoring | ITSM | DevOps | Cloud
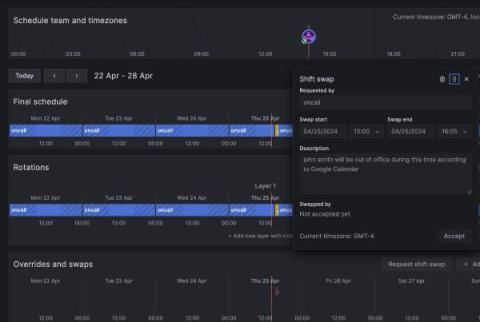
PTO peace of mind: Sync Grafana OnCall with Google Calendar out-of-office events
Sometimes, the little things can make a big difference. We’ve added a new feature in Grafana Incident & Response Management (IRM) that lets you sync your Google Calendar out-of-office events with Grafana OnCall.
How Dell ISG Consolidated Observability Tooling Without Losing Functionality | Grafana Customer
In this recorded session, Brian Murphy, Technical StafF SRE at Dell Technologies shares how his team, Dell ISG consolidated Observability tooling without losing functionality using Grafana Cloud. The ISG team own “Northstar Tooling” which consists of Artifactory, Github Enterprise, Jenkins, and more. They also They also manage the Internal Cloud and k8s clusters, as well as all the hardware and networking that goes with it.
OpenTelemetry Looks Good To Me: Loki, Grafana, Tempo, Mimir | GrafanaCON 2024 | Grafana
In this talk, D-EDGE Principal Engineer Clément Boudereau introduces you to Loki for logs, Tempo for traces, and Mimir for metrics by using two simple Java applications, OpenTelemetry, and Grafana dashboards. Helpful links:☁️ Grafana Cloud is the easiest way to get started with Grafana dashboards, metrics, logs, and traces. Our forever-free tier includes access to 10k metrics, 50GB logs, 50GB traces and more. We also have plans for every use case.
How to use the Grafana Operator: Managing a Grafana Cloud stack in Kubernetes
When deploying an application using Kubernetes, you get used to all your resources being manageable by describing them to the Kubernetes API. Whether it’s deployments, secrets, configurations, or entire machines, everything exists as code somewhere. Introducing a cloud service into such an environment often means introducing additional ways to configure it, which can become cumbersome, given the rising number of cloud services modern applications depend on.
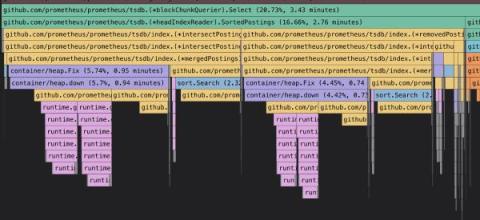
The loser tree data structure: How to optimize merges and make your programs run faster
“Okay,” said Bryan Boreham, distinguished engineer at Grafana Labs, as he took to the stage at GopherCon 2023 in September. “Who loves algorithms?” A room full of software engineers raised their hands in response — and with that, Bryan kicked off his talk at the annual event dedicated to the Go open source programming language. GopherCon 2023, which took place in San Diego, Calif.
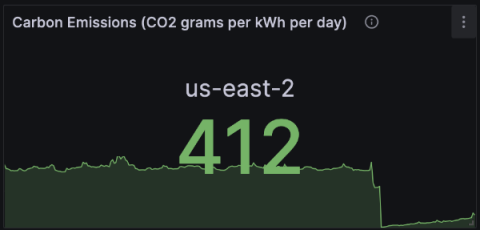
Going green: How to monitor your cloud carbon footprint using Kepler, Prometheus, and Grafana
At this point, the technical and operational benefits of cloud computing are pretty much indisputable. But the cloud industry, as a whole, still has a long way to go in one critical area: sustainability. In fact, as shocking as it may sound, it’s estimated that cloud data centers have a greater carbon footprint than the entire aviation industry. Ida Fürjesová and Niki Manoledaki, both software engineers at Grafana Labs, are passionate about helping to change that.
Beginners Guide - How to Configure a Candlestick Visualization | Grafana
💡 What is a candlestick and how can you visualize price movements in Grafana? Join Senior Developer Advocate Marie Cruz in this beginner-friendly tutorial to learn what candlesticks are and how to configure a candlestick visualization in Grafana.
Structure of Logs (Part 2) | Zero to Hero: Loki | Grafana
Have you just discovered Grafana Loki? Zero to Hero: Loki is a series of videos that aims to take you through the basics of ingesting, your logs into Grafana Loki an open-source log aggregation solution. In this episode, it's all about the structure of logs. In part 2 we cover the different ways a log can be formatted. ☁️ Grafana Cloud is the easiest way to get started with Grafana dashboards, metrics, logs, and traces. Our forever-free tier includes access to 10k metrics, 50GB logs, 50GB traces and more. We also have plans for every use case.
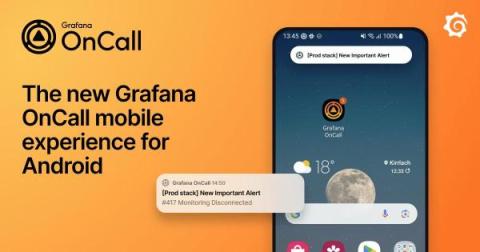
Grafana OnCall mobile app notifications: The new and improved experience for Android users
The Grafana OnCall mobile app is an essential tool for on-call engineers to monitor and respond to critical system events. Available for both iOS and Android, the app offers a range of features and notification settings that make the on-call experience easier and more intuitive — all in the palm of your hand.


